Recent Developments Steering CARV’s Ecosystem
CARV has been making some pretty interesting moves lately. The project rolled out its D.A.T.A. Framework 2.0, which basically combines DeepSeek’s reasoning models with the CARV ID system using the ERC-7231 standard. What this means in plain English is that AI agents can now better understand and work with both off-chain and on-chain data, making them smarter and more autonomous when it comes to economic decisions. If this works as intended, we should see more actual use cases for the CARV token.
There’s also Cashie 2.0, which is part of CARV’s broader push into what they call “agentic infrastructure.” It’s designed to reward people for their social engagement through identity proofs, with rewards distributed automatically using on-chain tools like the x402 Facilitator. The idea seems to be attracting more users and keeping them engaged through social interactions and agent-driven rewards, which could be a game-changer if it catches on.
Current Price, Trend Analysis & Technical Indicators
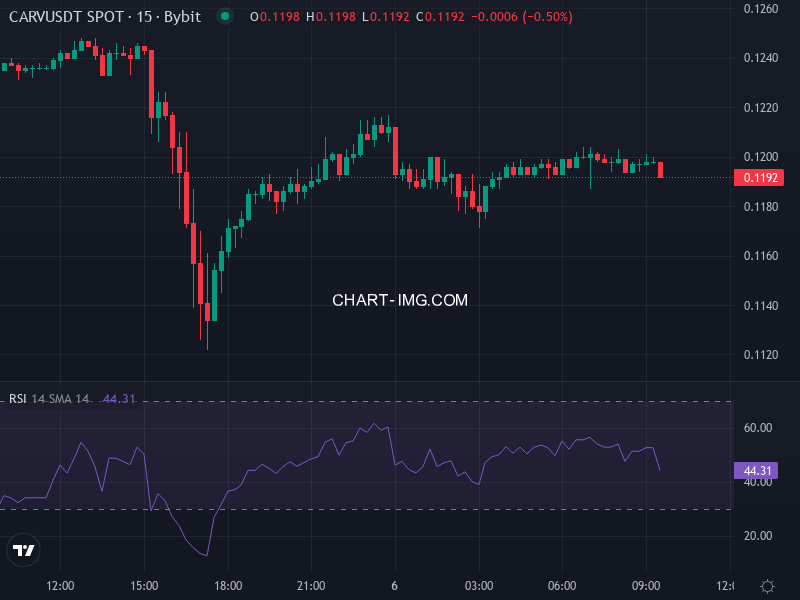
Right now, CARV is trading at around US$ 0.11981244, which is down roughly 3.50% in the last 24 hours. The price has slipped below several important moving averages—the 20, 50, 100, and 200-period SMAs are all sitting above the current price. That’s generally not a great sign, as it suggests there’s resistance overhead and the medium-term trend is looking bearish.
Looking at momentum, the 14-period RSI is hovering around 42.7. It’s not screaming oversold, but it’s definitely not bullish either—there’s room for the price to drop further before we might see a bounce. The MACD is in negative territory, which backs up the selling pressure we’re seeing. Meanwhile, the ADX is sitting near 29, telling us the current trend—unfortunately a downward one—has some real strength behind it.
Support & Resistance Zones
Based on the moving averages and recent price action, the key resistance zone is between US$ 0.122 and 0.1265—that’s roughly where the 100- to 200-period SMAs are hanging out. If the price rallies into that area, expect sellers to show up. On the flip side, there’s solid near-term support in the US$ 0.116–0.118 range. If that breaks, we’re probably looking at 0.110 as the next stop. The Fibonacci pivot point is sitting near 0.1196, which gives us a short-term reference point.
Price Scenarios & Projections Based on Indicator Signals
Let’s look at three possible scenarios for where CARV might be headed:
Scenario A (Bearish Continuation): If support around US$ 0.116 doesn’t hold, things could get ugly fast. We’d likely see a drop toward US$ 0.10–0.11. This scenario plays out if the MACD stays negative, the price can’t reclaim the SMA50, and the RSI drops below 40.
Scenario B (Moderate Reversal): A bounce back above the SMA50 (around 0.122–0.124) with some positive MACD action and decent volume could push us toward US$ 0.14. For this to happen, we’d need to see the RSI climb back above 50 and those moving averages start acting as support instead of resistance.
Scenario C (Optimistic Upside): If CARV actually delivers on its protocol upgrades and the whole social-agent incentive thing takes off, we could see some real momentum. A break above US$ 0.14–0.15 isn’t out of the question, potentially reaching US$ 0.16, though that’s where things get tough with heavy resistance.
Volatility, Risk, and Volume Profile
The ATR (Average True Range) is elevated, which means we should expect some wild price swings. Volume has been pretty inconsistent and generally low, suggesting people aren’t exactly rushing in with conviction right now. In markets like this, oscillators like Williams %R and Stochastic might flash overbought or oversold signals, but without solid volume backing them up, those reversals probably won’t stick.
On the risk side, we’ve got the usual suspects: broader crypto market selloffs, potential regulatory crackdowns on AI-related tokens, or CARV simply not delivering on its promises around agent autonomy and identity verification. But there are positives too—active product launches like Cashie 2.0, new partnerships, and funding could all provide upward momentum.
Probable Price Path Over Short-to-Medium Term
Looking at the technicals and what’s happening with development, the most likely scenario over the next 2-4 weeks is that CARV bounces around between US$ 0.11 and US$ 0.13. Expect multiple tests of resistance near 0.123–0.125. If sentiment stays weak, we’ll probably revisit 0.11. If things start looking up, we might break through the upper end of that range.
Over the next 3 to 6 months, everything hinges on execution. If CARV actually delivers on its agentic tools, gets adoption for Cashie, and brings in users and developers, we could see a move toward US$ 0.20. But if there are delays or things don’t work out, CARV might just grind sideways in the US$ 0.08−0.12 range, stuck under that resistance.
Strategic Takeaways for Traders and Investors
For traders: keep your risk tight. If you’re going long, look for entries near support (0.116–0.118) with stops just below for a decent risk/reward setup. A breakout above resistance around 0.125 could offer a short-term long opportunity. If you’re thinking about using leverage, wait for clear bullish confirmation—a MACD crossover or break above the SMA50. And whatever you do, watch the volume. Strong volume makes moves believable; weak volume doesn’t.
For long-term investors: keep an eye on whether they actually deliver on their roadmap—particularly the agent framework, identity adoption, and whether CARV can actually monetize this whole data-ownership concept. If they execute well and the price stays above major support levels while hitting milestones, holding could pay off. It’s all about whether they can align the technical picture with real fundamental progress.