Recent Developments & Ecosystem Insights
CARV has been steadily evolving into something bigger than its initial gaming-token roots—it’s now positioning itself as an identity-focused, on-chain AI agent platform. Late in 2025, the team rolled out Cashie 2.0, a pretty interesting protocol that lets users turn social actions like retweets into actual on-chain rewards. It works through gasless payments and AI agents, all powered by CARV’s identity infrastructure. While the tech is promising and adoption potential looks solid, the price hasn’t really reflected that excitement yet. Early investors jumped in on the hype, then cashed out profits shortly after launch, which dampened any immediate momentum.
Before that, CARV upgraded its D.A.T.A. Framework by adding a “Shielded Mind” privacy layer along with zero-knowledge proofs. This wasn’t just a flashy update—it shows the team is serious about data sovereignty and making sure AI agents can operate securely. They’ve also been busy forging partnerships across AI, infrastructure, and consumer-facing projects. Increasingly, people in the space are viewing CARV less as a gaming play and more as a foundational layer for coordinating AI activities on-chain.
Current Technical Indicators & Price Levels
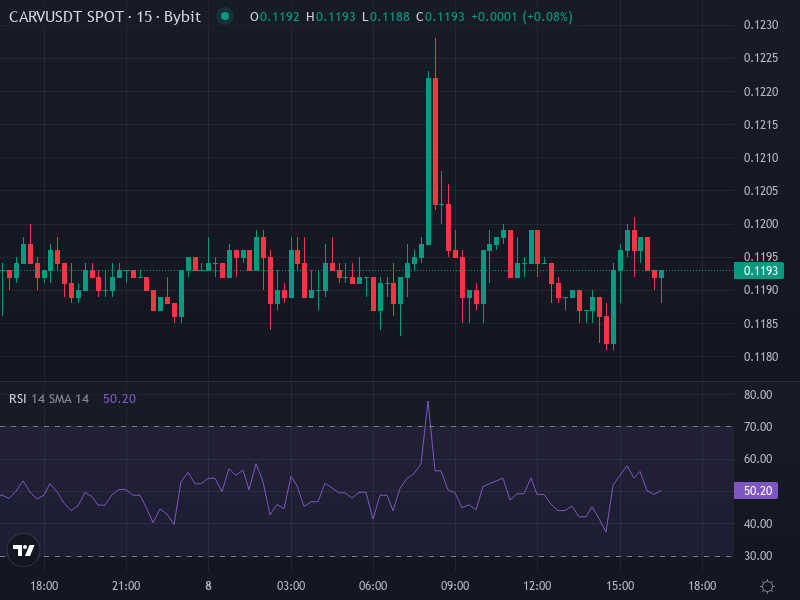
Right now, CARV is trading around $0.11897, down about 0.17% over the past 24 hours. Technically speaking, things look pretty bearish on the daily chart. Nearly all the moving averages—whether you look at the 5-day, 10-day, 20-day, or even the 50-, 100-, and 200-day—are sitting above the current price. That’s a classic sign of a downtrend that’s been in place for a while. Momentum indicators like the MACD are negative, and the RSI is floating in the low 30s to 40s. That typically signals oversold territory, but we’re not seeing any strong signs of a reversal just yet.
On the support side, $0.1207 is a level to watch—it’s a recent low where there’s been some buying interest, though not particularly strong. Resistance is likely lurking around the $0.140-$0.155 zone, where the 50-day and 100-day moving averages are hanging out. If you zoom out and look at Fibonacci retracements from earlier price swings, the 38-61.8% levels were somewhere between $0.206 and $0.260. So for CARV to really shift back into bullish mode, it would need to climb past that $0.155 mark with conviction.
Indicator Summary
- RSI (14-day): Sitting in the low-to-mid 30s—oversold, but not yet giving us a clear reversal signal.
- MACD: Below the zero line, pointing to ongoing bearish momentum.
- ADX: Showing moderate to strong trend strength, but right now that trend is pointing downward.
- Moving Averages: Price is below every key moving average—especially the 50-, 100-, and 200-day lines, which isn’t a good look.
Scenario-Based Price Forecasts
So where does CARV go from here? With solid fundamentals on one side and weak technicals on the other, there are really two ways this could play out over the next couple of months:
- Bullish Reversal Path: If demand starts picking up—maybe from growing adoption of Cashie 2.0, fresh partnerships, or a surge in developer activity—CARV could push back toward that $0.140-$0.155 resistance zone. Breaking above $0.155 and holding above the 50-day moving average would be a big deal. From there, a move toward $0.180 isn’t out of the question, especially if volume and sentiment line up. This scenario depends on a real catalyst or consistent positive news to get things moving.
- Bearish Continuation Path: On the flip side, if buying pressure doesn’t show up—or if the broader crypto market hits a rough patch (think macro worries, interest rate jitters, etc.)—CARV could keep drifting lower. The key risk is breaking below that $0.1207 support level. If that happens, we could see prices slide toward $0.100 or even lower, depending on how exhausted sellers get. Right now, momentum indicators and moving averages are both pointing toward more downside risk.
What to Watch Closely
If you’re holding CARV or thinking about a trade, here are a few things worth keeping an eye on to figure out which scenario is more likely:
- Volume spikes: If you see trading volume picking up during upward moves, that’s a sign buyers are actually committed. Without volume, any rallies are probably going to fizzle out quickly.
- Macroeconomic and sector cues: How are AI tokens performing overall? Are there any regulatory developments around privacy or identity tech? What’s happening with gas costs and network congestion on the Base chain? All of these can shift sentiment pretty fast.
- Technical breakouts: Watch for price closes above the short-term moving averages, especially around $0.14-$0.155. If CARV can push through that resistance and the MACD flips positive, the bias would shift toward bullish.
- Support strength: If $0.1207 holds firm even under selling pressure, we might see some accumulation around that level. But if it breaks, expect downside to accelerate.
Based on what we’re seeing right now, the near-term technical outlook leans bearish. There’s not a lot of upside unless something changes structurally or we get a solid news catalyst. That said, if you’re thinking long-term—like 6 to 12 months out—and CARV’s agent networks, identity solutions, and privacy tech start gaining real traction, there’s definitely room for a moderate recovery down the line.