
Current Market Dynamics & Recent Sentiment Shifts
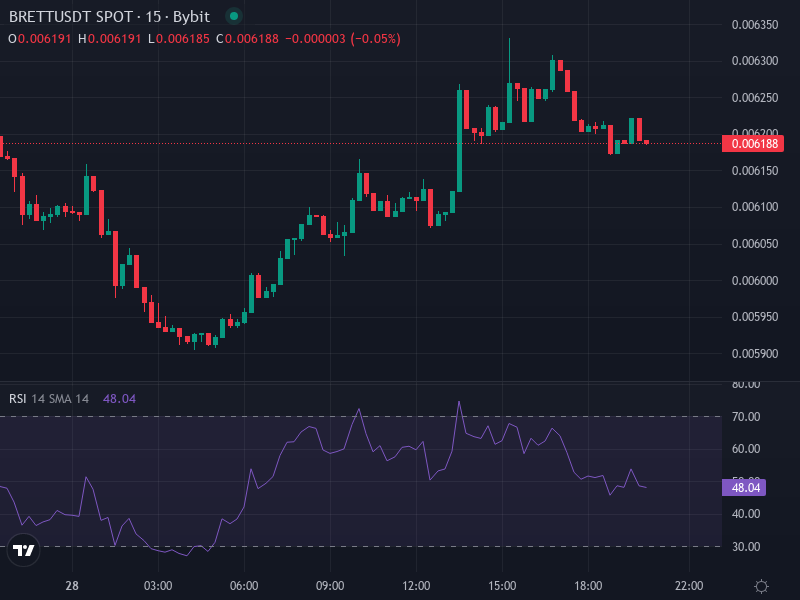
BRETT (Based) is currently trading at around $0.00617692 on the BRETT/USDT pair, with a modest 24-hour gain of about 0.20%. While this small bump might feel like a relief, the bigger picture tells a different story. When you look at the major technical indicators and what the community is saying, it’s clear the market is still struggling. All the important daily moving averages—the 50-day SMA, 100-day EMA, and 200-day EMA—are sitting well above where the price is now, which basically screams long-term bearish pressure. The Relative Strength Index is hovering somewhere between 25 and 35 depending on which analysis you check, putting it firmly in oversold territory. That means we might see a bounce, but it doesn’t necessarily mean we’ve hit the bottom yet. If BRETT tries to climb back up, it’ll likely face some tough resistance around $0.0080 to $0.0100, with support barely holding near the recent lows around $0.005 to $0.0062.
On the news front, BRETT has been quietly building some legitimacy through partnerships and integrations rather than flashy new features. The MocaProof integration for ownership verification and payments is a step in the right direction, and there’s talk of new centralized exchange listings either happening or in the works. That said, there have been some promotional hiccups that raised eyebrows, and the fact that major platforms like Coinbase still haven’t listed it keeps a lot of people on edge. Right now, it’s a weird mix of meme coin excitement and people being cautiously skeptical.
Technical Indicators Breakdown & What They Signal
Looking at the daily charts, pretty much everything points to a bearish setup. The moving averages across all timeframes—whether short or long—are above the current price and heading downward, basically acting like ceiling tiles BRETT keeps bumping its head against. The RSI being at or below 30 tells us the token is oversold, which usually means a bounce could be coming, but the MACD isn’t giving us much hope yet—it’s sitting neutral or slightly bearish with no strong signal of an upward crossover. The ADX readings are moderate to high, which means the trend has strength, and unfortunately that trend is dominated by sellers right now. Volatility is running high too, with the ATR showing us that big swings are possible, which also means there’s a real risk of fake breakouts that trap traders.
The levels you really need to watch are around $0.0058 to $0.0062 for support—though that support looks a bit shaky based on recent action—and resistance sitting between $0.0080 and $0.0100. Breaking above $0.0100 would definitely help flip the short-term sentiment, but even then, those longer-term moving averages would still be sitting overhead, ready to push back against any bullish momentum.
Short-Term Projection (Next 1-4 Weeks)
With the RSI this oversold and a little bounce happening off support levels, BRETT might take a shot at testing that $0.0080 resistance. If trading volume actually picks up, we could see it stretch toward $0.0090 before running into that overhead pressure again. But here’s the thing—without some real catalyst like a major exchange listing, actual utility adoption, or big moves in the Base network, we’re more likely looking at sideways action or even a drift back down toward $0.0060 to $0.0055. Oversold bounces rarely turn into sustained rallies without something concrete to fuel them.
Medium-Term & Long-Term Scenarios (1-6 Months)
If things stay neutral to bearish, expect BRETT to trade in a range between $0.0050 and $0.0100 for the next few months. Now, if the broader memecoin market heats up or the Base ecosystem really starts gaining serious traction, there’s a bullish scenario where BRETT could target $0.0150 or even higher—but that would require taking back those moving averages and breaking through some serious resistance levels. On the flip side, if support breaks or sentiment gets worse—think regulatory trouble or bad press—we could easily see prices drop below $0.0050, maybe even down to the $0.0030 to $0.0040 range, which would mark multi-month lows.
Key Takeaways for Traders & Investors
Keep your eyes peeled for volume spikes or meaningful news—things like exchange listings, real community growth, or solid utility partnerships—because those could really shift the momentum upward. Without those catalysts, the odds are tilted toward either downside or just spinning wheels. If you’re actively trading, getting in around $0.0060 with a tight stop-loss below $0.0055 gives you a decent risk-to-reward setup. A breakout above $0.0090 with strong volume could open the door to targets around $0.0100 to $0.0125. For those holding long-term, it might be smart to diversify or hedge your bets, because let’s be honest—BRETT’s path upward depends a whole lot more on meme cycles and hype than on any real fundamentals.