
Recent Developments & Current Market Context
BICO is currently hovering around $0.04160 (USDT), down about 1.07% in the last 24 hours. The token is clearly feeling the heat—mirroring the broader weakness we’re seeing across altcoins, with Bitcoin hogging the spotlight and network activity looking pretty sluggish. The technical picture backs up this cautious vibe: moving averages are painting a bearish picture, momentum indicators are flashing oversold warnings, and there’s no convincing sign of a turnaround yet. Strong Sell signals are dominating across both daily and weekly charts right now.
Indicator Analysis: What the Charts Say
Looking at the 4-hour chart:
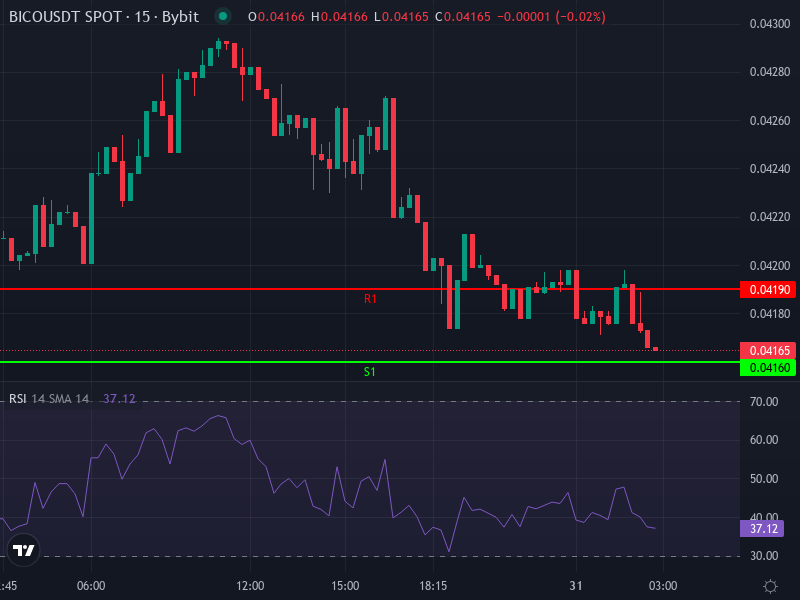
- The Relative Strength Index (RSI) is sitting at roughly 39—not quite in deeply oversold territory yet, which means there’s potentially more downside ahead than upside.
- The MACD is showing a negative histogram with the MACD line sitting below its signal line, confirming that bearish momentum is still in control.
- Price is trading below the key moving averages—both the SMA (around $0.04292) and EMA (around $0.04265) are acting as resistance on the 4-hour timeframe.
Zooming out to the daily chart:
- Every moving average—from the 5-day all the way to the 200-day—is trending down with price stuck underneath them all.
- The 14-day RSI is hanging out in the mid-30s, which is oversold territory, but we’re not seeing the kind of bullish divergence that would suggest a reversal is coming soon.
- Pivot points are pointing to resistance around $0.0418–$0.0422, while support levels are clustered near $0.0416, with the next floor down around $0.0413 if bears keep pushing.
Price Scenarios & Projections
Bull Case
If BICO manages to punch through the short-term resistance wall around $0.0422–$0.0425, we could see it climb toward $0.0440–$0.0450. For this to happen, we’d need to see a MACD crossover on the higher timeframes, RSI climbing back above 50, and—crucially—a meaningful uptick in volume. That said, with altcoins generally struggling and Bitcoin dominance staying high, this scenario feels like the underdog right now.
Bear Case
The more likely path in the near term? BICO struggles to clear those resistance levels and continues drifting lower. If it breaks below $0.0413, we’re looking at $0.0399–$0.0400 as the next support zone—a level that matters both psychologically and technically. If that doesn’t hold, we could see a slide down to $0.0380–$0.0390. Right now, sellers are in the driver’s seat; those oversold readings might trigger some short covering, but that’s not the same as a full-blown reversal.
Watchlist Triggers & Risk Factors
Here are the key things to keep an eye on that could shift the momentum:
- Trading volume—particularly in spot markets—is absolutely critical here. We’ve been seeing pretty anemic volume, which has been holding things back.
- Bitcoin dominance and the bigger macro picture. As long as BTC keeps pulling capital away from the rest of the market, altcoins like BICO are going to stay under pressure.
- On-chain metrics: things like active addresses, transaction growth, and smart contract deployment. These have been pretty stagnant lately, which isn’t a great sign.
- Any potential catalysts—new partnerships, exchange listings, or network upgrades—these are the kinds of events that can spark short-term rallies out of nowhere.