
Recent Developments & Market Context
BEAM’s ecosystem has been showing some interesting growth over the last month or so. The Sphere NFT marketplace is getting a pretty substantial overhaul—they’re planning to add cross-chain compatibility and better discovery features, which should make things easier for users. There’s also been a new exchange listing on Hotcoin that opened up BEAM/USDT trading under the BEP-8004 protocol. Plus, they’ve tweaked the unstaking mechanics to make participation less of a headache. All of this matters because it improves liquidity, access, and just overall usability of the network—fundamentals that actually mean something when you’re trying to predict where price might head.
On the tokenomics side, the deflationary pressure is legit. The Beam Treasury dashboard shows they’ve burned over 40.26 billion BEAM tokens already, which is a significant chunk taken out of circulation compared to the max supply. That’s not nothing.
Technical Indicators & Key Levels
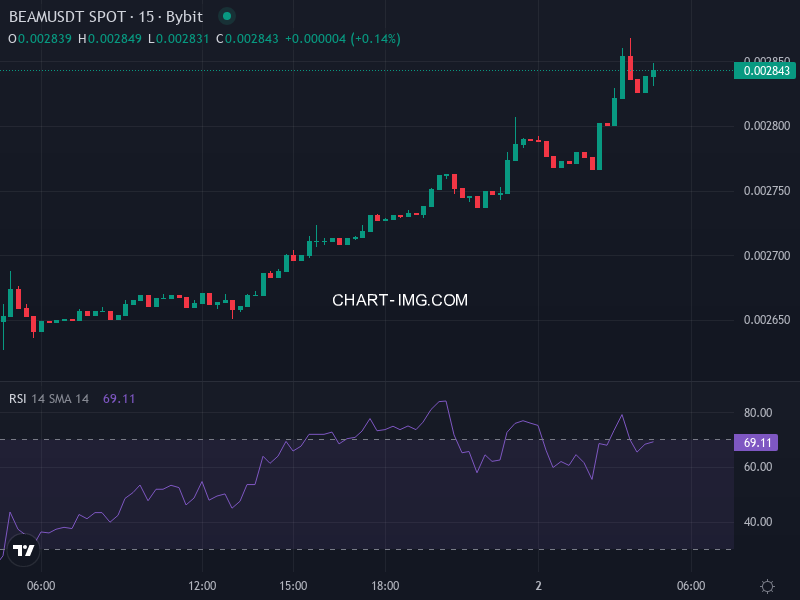
Looking at the latest technical readings, BEAM’s moving averages across the shorter timeframes are painting a mixed-to-bullish picture. The RSI is sitting somewhere in the neutral zone—think mid-40s to low-60s—so we’re not dealing with overbought or oversold extremes right now. What’s interesting is the Stochastic RSI, which is leaning toward “oversold” territory in some frames, hinting at potential buy signals. On the flip side, Williams %R and MACD divergence are showing weakness or outright bearish vibes on certain charts, so it’s definitely not all sunshine.
If you’re into pivot point analysis, the immediate resistance levels sit around $0.02661, $0.02737, and $0.02783 USDT. Support is hanging out near $0.02539, $0.02493, and the strongest zone is down at $0.02417 USDT. Historically, that lower zone has acted as a solid demand area where buyers tend to step in.
Volume and trend strength indicators like the ADX suggest there’s a trend forming, but it’s not particularly strong yet. There’s directional bias, sure, but momentum hasn’t really committed to the bulls in a decisive way.
Price Predictions & Scenario Mapping
Bull Case:
If BEAM can hold that $0.024–$0.025 USDT support zone, we could see a bounce targeting resistance around $0.0266–$0.028 USDT. Breaking above $0.028 with decent volume would be the green light for a move toward $0.030–$0.032 USDT. That aligns pretty well with some mid-term Fibonacci resistance zones—like the 0.5 or 0.618 retracements from recent downtrends. In this scenario, you’d probably see some short-term pullbacks near $0.025, but they’d be shallow if buyer momentum actually returns.
Bear Case:
Now, if BEAM loses that $0.024 USDT level, things could get ugly fast. We’d be looking at a deeper slide toward $0.0225 or even $0.020 USDT. The oversold indicators are already flirting with threshold levels, so a breakdown could trigger panic selling pretty quickly. MACD and Williams %R would likely turn even more negative, and breaking below support would basically invalidate the bullish reversal patterns that some analysts have been pointing to.
Trading Strategy & Observations for Investors
For active traders, that pivot resistance zone between $0.0266–$0.028 is a solid area to think about taking profits if we get bullish strength. Setting stops just below $0.024 USDT makes sense, and you’ll want to adjust them if there’s a clean break either way. For longer-term holders, accumulating near those strong support zones—especially with the deflationary tokenomics in play—might offer some decent risk-reward asymmetry. Just make sure any breakout you’re watching has volume behind it. Weak volume breakouts fail more often than not, and you don’t want to get caught on the wrong side of that.