
Current Sentiment & Recent Developments
Altlayer (ALT) is currently changing hands around $0.00790, having taken a beating with a sharp –13.42% drop in just the last 24 hours. This isn’t happening in a vacuum—broader crypto markets are getting hammered alongside some ALT-specific challenges. We’ve seen a lot of fear creeping into the market lately, with investors rotating away from riskier altcoins. ALT got caught in the crossfire after failing to break through resistance near $0.0095–$0.010, which brought more sellers into the picture.
That said, the team behind ALT hasn’t been sitting on their hands. They’ve been pushing forward with the x402 Suite, which introduces pay-per-request features that align with Coinbase’s payment standards. Plus, they’re working toward wrapping up a SOC 2 Type II audit by Q1 2026. These developments could prove valuable down the road for enterprise adoption and legitimacy, though right now the market doesn’t seem to care much while the selling continues.
Technical Indicators: Oversold Signals, Key Levels to Watch
Let’s break down what ALT’s charts are telling us right now on the 4-hour timeframe, which should help us spot where things might turn around—or keep falling:
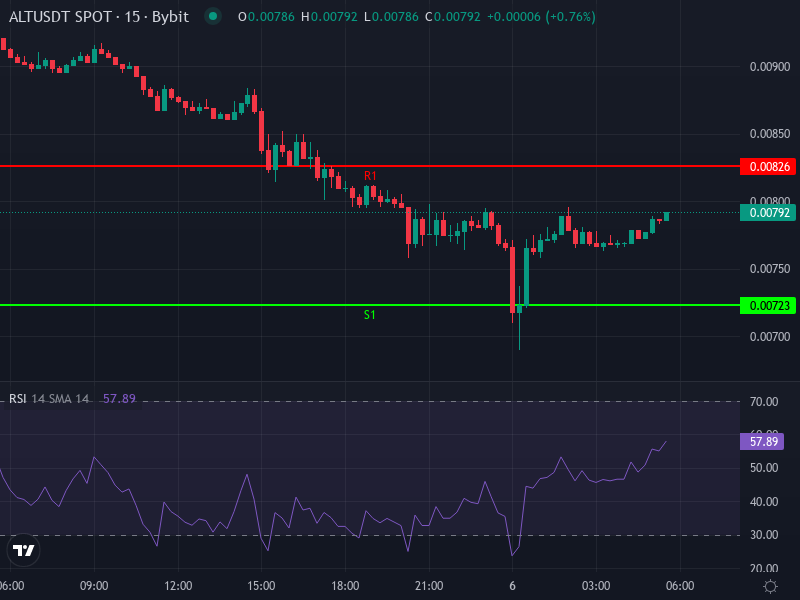
- RSI (4h): Sitting at around 28.46, just below that oversold mark of 30. This tells us sellers might be getting tired, but we haven’t seen any clear sign of a turnaround yet.
- MACD (4h): The MACD line is at roughly –0.000500, signal line at –0.000365, with a negative histogram around –0.000135. Everything here points to continued downward pressure with bears firmly in control.
- SMA vs EMA (4h): ALT is trading underneath both its Simple Moving Average (about $0.00915) and Exponential Moving Average (around $0.00907). These levels are now acting as overhead resistance that needs to be cleared.
- Daily Pivot Levels: The pivot point is hovering around $0.0075867, with resistance zones between roughly $0.00826 and $0.00929, while support stretches down toward $0.00620. Right now, price is dancing near the lower end of the daily range, making that $0.00620 level something to watch if things get worse.
- Rate of Change (1d ROC): Down about –30.8% on the day—that’s brutal and suggests either panic selling or liquidations cascading through.
Short-Term Projections: 1–7 Days
Looking at the next few days, ALT will likely test resistance at that 4-hour EMA and SMA cluster around $0.0090–$0.0092. If it can push through there, we might see some breathing room and possibly a bounce attempt. But if it gets rejected again, we’re probably headed lower, with the daily pivot around $0.00759 as the first stop. If that doesn’t hold, $0.00620 comes into play—especially if we see real capitulation. The oversold RSI hints that a relief bounce could happen, but it’s not strong enough yet to call a trend reversal.
Mid- to Long-Term Outlook: Q1–Q2 2026
Zooming out over the coming weeks and months, whether ALT can start climbing again really comes down to two things: first, whether their infrastructure upgrades actually lead to real usage growth, and second, whether the market can absorb upcoming token releases without tanking the price further. Some optimistic forecasts are floating around suggesting ALT could hit around $0.024 by the end of 2026—a pretty massive recovery—but those assume the market heals and adoption picks up. If we stay in this bearish environment and demand stays weak, ALT could easily stay stuck between $0.005 and $0.010 for a while.
Leadership & Catalysts: What Could Shift the Bias?
A few things could flip the script here. First up is finishing that SOC 2 Type II audit, which would be a big credibility boost—especially for institutional players and developers who care about security and compliance. That could bring fresh money in. Second, if the x402 Suite gains real traction and developers start sharing adoption numbers or integrations, that’s fuel for a rebound. Third, we could see a broader market turnaround where risk appetite returns to crypto and altcoins catch a bid across the board. Without any of these happening, we’re stuck dealing with token oversupply, weak trading volume, and resistance overhead keeping price pinned down.
Probable Price Scenarios & Risk Map
Here’s how things could play out depending on whether we get those catalysts and how the technical levels hold or break:
- Bull Case: ALT reclaims the $0.0090–$0.010 area with solid volume and positive news, then pushes toward $0.012–$0.015. This needs consistent strength and improving sentiment to work.
- Base Case: Price just chops around between $0.00650 and $0.0090, hovering near that $0.0075 pivot. Markets stay weak, and any oversold bounces don’t last long.
- Bear Case: Support at $0.00620 breaks, and we slide down toward $0.0050 or even lower. This would probably come from a broader market shock or disappointment on the audit/adoption front.