
Introduction: Project Progress & Market Context
Alchemy Pay (ACH) has been busy lately with some pretty significant moves to expand what it can do and strengthen its regulatory standing. The big news includes rolling out a public testnet for their new Alchemy Chain blockchain back in February 2026, plus they’ve updated how their token supply works to better match network growth and keep the ecosystem healthy long-term. On top of that, they’re making progress on the licensing front—ACH now has Money Transmitter Licenses in several U.S. states and counting, with more international compliance work in the pipeline.
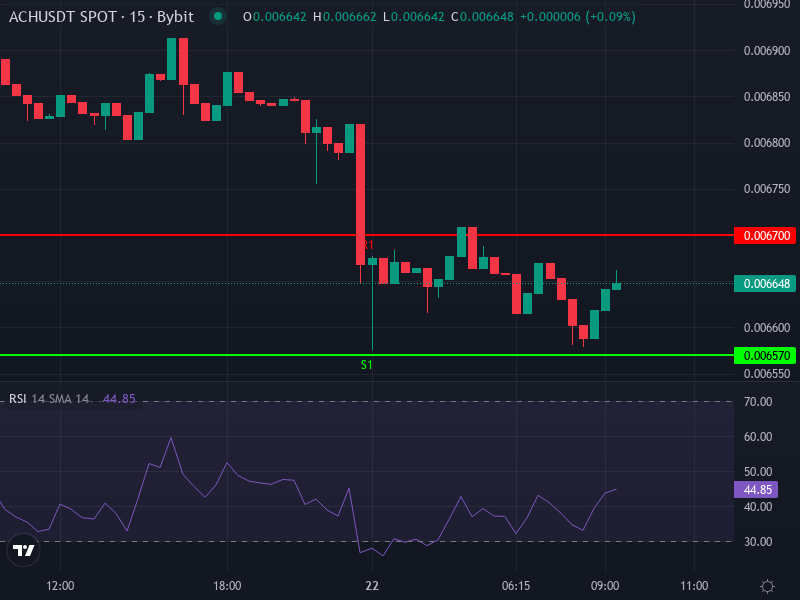
That said, the market hasn’t exactly been kind to ACH recently. Over the past 24 hours, ACH/USDT dropped about 3.24%, showing some clear short-term weakness. Right now it’s trading around 0.00663 USDT, which is quite a bit below recent resistance levels and way off from where it peaked before. The broader crypto market’s been pretty cautious lately, and that weak momentum is definitely dragging on ACH’s price.
Technical Overview: Indicators & Key Levels
Looking at the 4-hour chart, ACH/USDT is showing an RSI around 30.25, which means it’s getting close to oversold territory. The momentum indicators aren’t looking great either—MACD is sitting below its signal line with the histogram confirming bearish divergence. Both the Simple Moving Average (around 0.007006) and Exponential Moving Average (about 0.006913) are above the current price, which tells us there’s resistance overhead and downward pressure right now.
When we look at pivot points on the daily chart, there’s important resistance between 0.00670 and 0.00683 USDT (R1, R2, R3). Support levels are stacked around 0.00657, 0.00651, and 0.00644 respectively, with the daily pivot sitting near 0.00664. The rate of change for today’s close price is down 2.21%, which just reinforces that short-term bearish feel.
Resistance & Support Structure
The immediate resistance we need to watch is right around 0.00670 USDT, extending up toward 0.00683 USDT. If price can push above 0.00700 USDT, that would actually be a pretty bullish sign since that’s where those short-term moving averages are clustering. On the flip side, if we break below support at roughly 0.00650 USDT, things could get dicey—price might head down to 0.00640 USDT or even test that lower support band around 0.00644 USDT.
The volatility has been pretty contained lately, with narrow trading ranges over recent sessions. This suggests tension is building around these levels. Without some kind of strong catalyst, we’ll probably just see price bounce around between resistance and support for a while.
Price Prediction Scenarios
Based on what the charts are telling us and the recent fundamental news, here’s how ACH/USDT might play out in the coming weeks and months:
- Bullish Scenario: If ACH can break through that resistance cluster around 0.00683–0.00700 USDT—maybe helped by strong adoption of Alchemy Chain or some big regulatory wins—we could see it climb toward 0.00850 USDT. That would put it just below some higher long-term moving averages, which might kick off even more upward momentum.
- Base Case / Sideways Consolidation: Price keeps bouncing between support at 0.00650 USDT and resistance near 0.00680 USDT, basically trading in a range from about 0.00640 to 0.00710 USDT. In this scenario, expect some ups and downs but nothing dramatic—no major breakout or breakdown.
- Bearish Scenario: If the broader market stays weak, or if there’s bad news, or if ACH doesn’t deliver on its blockchain or regulatory promises, we could see it drop below that 0.00650 USDT support level. From there, the downside risk extends to 0.00640 USDT or lower—potentially down to around 0.00620 USDT—unless buyers step in hard or we get some unexpected good news.
Final Insight: Key Catalysts & Risk Factors
For ACH to really take off on the upside, we’ll need to see some concrete results from Alchemy Chain now that the testnet is live, proof that demand for ACH as a fee token is actually growing, and regulatory clarity or new licenses that encourage institutional and merchant adoption. Positive developments around their supply framework or new revenue streams—like stablecoin payments or real-world asset platforms—could really shift sentiment in their favor.
On the downside, watch out for delays in the mainnet launch, disappointing execution on tokenomics, inflation from expanded supply, or broader crypto market troubles like regulatory crackdowns or Bitcoin weakness. These would all be red flags. If you’re trading this, keep an eye on volume spikes when price tests resistance, and make sure RSI and MACD are actually confirming any trend reversal before jumping in with aggressive positions.