Recent Developments and Market Context
ALCH token has been going through some rough patches recently. The platform rolled out some pretty significant upgrades in mid-2025—including GPT-5 integration and better rendering pipelines—all aimed at making things easier for developers. These changes show the team is serious about building something solid for the long haul, though everyone’s still keeping an eye on whether people are actually using it. The bigger picture isn’t exactly rosy either: AI infrastructure tokens across the board have taken a beating, dropping more than 50% this year alone. Interestingly though, ALCH hasn’t been hit quite as hard. This relative strength might be coming from its unique features and growing buzz around no-code AI tools.
When you look at recent trading activity, the sentiment is all over the place. Futures markets have seen some wild speculative swings in volume, but spot trading shows things are mostly consolidating. The 14-day RSI is sitting in the mid-30s—momentum is definitely weak, though it hasn’t quite reached oversold territory yet. Most analysts are watching support around $0.11 and resistance somewhere between $0.13-$0.15 as the key levels to pay attention to.
Technical Indicators and Immediate Price Action
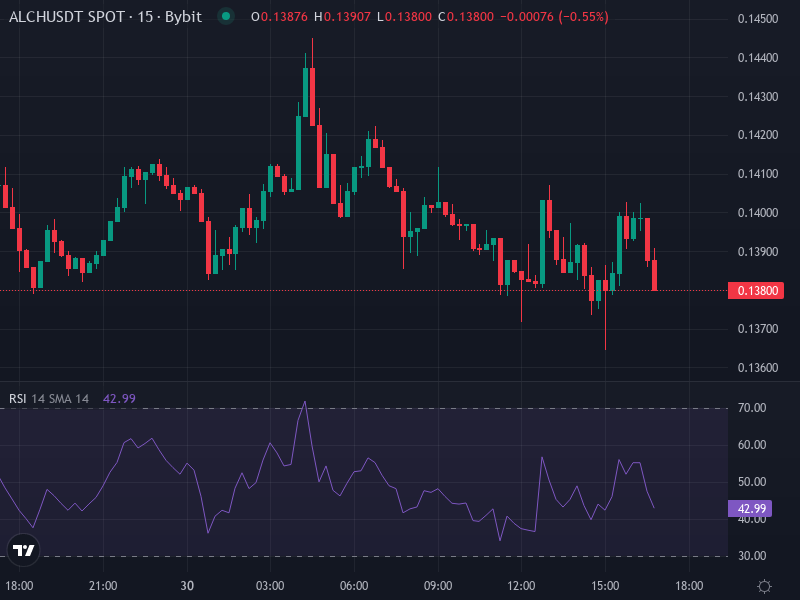
Right now, ALCH is trading at around **$0.13881**, down about -0.41% over the last 24 hours. Here’s what the technicals are telling us:
- 14-day RSI: Hovering around 34-37 — it’s below the neutral mark of 50 but still above the oversold threshold of 30. Basically, momentum is soft and leaning toward potential weakness.
- Support levels: The first major support sits at approximately **$0.1146**, with an even stronger floor around **$0.0983** if things really start to fall apart.
- Resistance levels: There’s resistance hanging around **$0.1345**, and if the price manages to push through, the next meaningful barriers are at **$0.1436-$0.1519**.
- SMAs (50-day vs 200-day): The 200-day simple moving average is projected around $0.0948, while the 50-day is closer to $0.1355. With price currently sitting just above the 200-day average, there’s some bearish potential lurking if support gives way.
Looking at the short term: ALCH will probably test that immediate resistance around $0.1345-$0.14. If it can’t hold support around $0.11, we could see it slide down toward $0.098-$0.10. Really, it’s going to come down to how support zones and trading volume interact—that’ll determine whether this consolidation breaks upward or downward.
Price Predictions: Scenarios for End-of-Month and Beyond
Based on what we’re seeing right now, there are basically two ways this could play out in the short to medium term:
Bullish / Neutral Scenario
If ALCH manages to break above that resistance near $0.135 and actually holds it, the next targets would be **$0.1436 to $0.1519**. This scenario would need some catalysts though—maybe increased product usage, better vibes in the AI-crypto space, or positive derivative flows. We might also see some big whale wallets start accumulating, which tends to stabilize things.
Bearish Scenario
On the flip side, if that $0.1146 support level breaks, we’re probably looking at a drop toward **$0.098 to $0.10**. That would take it below some important moving averages, which could trigger more selling pressure. Given that liquidity is pretty thin and overnight volatility is high, traders might get spooked and pull back.
Mid-Term Outlook (1-6 Months)
Looking ahead to Q1-Q2 2026, ALCH’s fate really depends on both what the team delivers and how the broader market behaves. In a bullish scenario, we could see ALCH climb toward **$0.20-$0.25**—but that’s assuming steady adoption, the team actually hits their roadmap milestones, and the AI narrative makes a comeback. If crypto sentiment stays gloomy and product usage doesn’t grow much, ALCH could just bounce around in the **$0.08-$0.12** range, especially if money keeps flowing to bigger, more established projects.
Various long-term projections put ALCH somewhere in the **$0.40-$0.60+** range for 2027-2028 if things go really well. But pretty much all these models stress that reaching those levels requires strong market conditions and flawless execution—no major hiccups allowed.
Natural Risk Factors & Key Catalysts
There are definitely some risks to keep in mind: regulatory uncertainty around AI tokens, broader economic headwinds, and those highly leveraged positions in derivatives markets that could unwind badly. The order books are pretty shallow, and those speculative volume spikes can make downside moves even nastier. On the positive side, potential catalysts include landing high-profile partnerships, showing strong developer engagement metrics, getting listed on new exchanges, or seeing real breakthrough adoption in actual applications.
Final Insight
With ALCH trading around $0.1388 right now, the near-term picture leans neutral to slightly bearish unless it can clearly break through resistance. That support around $0.11 is holding for now, and it really needs to stay there for any upside scenario to play out. If you’re invested in this, now’s the time to watch the technicals closely—volume patterns, RSI movements, and those moving-average crossovers—while also keeping tabs on actual product growth to protect against downside risk. There’s definitely long-term upside potential here, but the team needs to execute really well to turn that potential into actual price gains.