Recent Developments & Market Context
AIOZ Network has rolled out some pretty significant updates recently that are strengthening its position in the Web3 infrastructure landscape. Back in late January 2026, they launched AIOZ Pin—essentially a new layer designed to keep your files permanently accessible through their decentralized network of nodes. They also pushed out Hardfork v1.8, which brought some much-needed security improvements and better scalability. These technical improvements have gotten investors paying attention again, and analysts are now pointing to a solid support zone sitting somewhere between $0.060 and $0.068, with resistance likely showing up around $0.085 and $0.10. The overall vibe is still a bit cautious given how volatile the broader market has been lately, but AIOZ’s real-world utility in AI, storage, and streaming—the backbone of its DePIN ecosystem—are being highlighted as strong long-term drivers.
Technical Indicators & Price Action Analysis
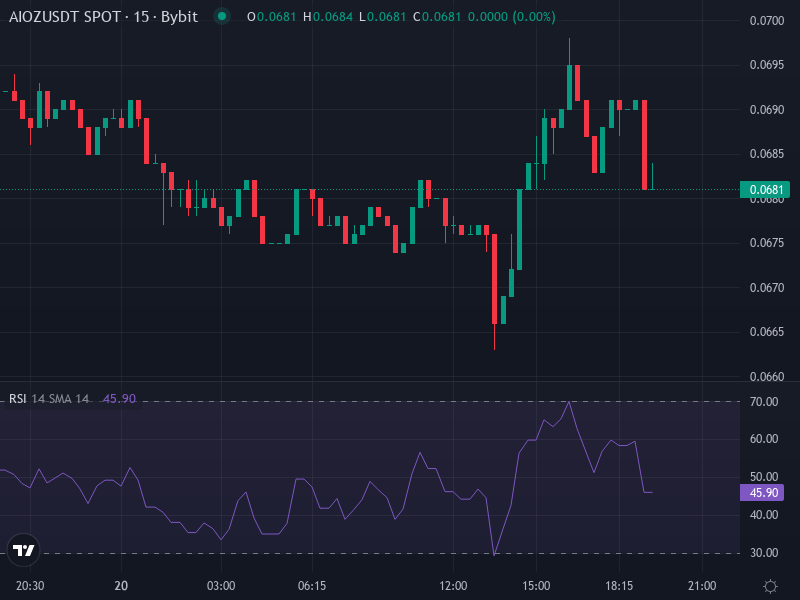
Right now, AIOZ is hovering around **$0.06849**, down about 1.0% in the last 24 hours. Looking at the technical signals, here’s what’s standing out:
- RSI (14) is sitting pretty close to oversold levels at around 28, which tells us the selling pressure has been intense but might be running out of steam. If those key support levels hold firm, we could see a bounce coming.
- MACD is slightly negative at the moment, pointing to a neutral-to-weak bearish trend. We haven’t seen a decisive crossover yet that would signal things are about to turn around.
- Moving Averages (EMA & SMA): AIOZ is trading well below its longer-term EMAs and SMAs (the 50 and 100 period ones), which confirms the overall trend is still bearish. The short-term moving averages are starting to converge near the current price though, which could act as initial resistance if buyers try to push things higher.
- Support & Resistance Zones – We’re seeing support levels around $0.0615, $0.0586, and roughly $0.048. On the flip side, resistance is showing up near $0.0852, with higher levels above $0.12. If price can’t hold above $0.06, we might see some sharper drops.
Visualizing Market Direction & Risk
The ADX is showing moderate strength but isn’t really screaming that there’s a strong trend in place. Volatility has cooled off a bit too. The Bollinger Bands aren’t showing price as massively oversold or stretched—basically, this points toward consolidation in the near term rather than wild price swings. Momentum indicators are giving us mixed messages: there are some weak bullish signals in the short term, but the longer timeframes still favor sellers.
Price Prediction: Scenarios & Forecasts
Taking into account the technical picture and what AIOZ has been building, here are a few scenarios we could see play out:
- Bearish scenario: If price breaks below that critical support around $0.060, the next stop is probably somewhere between $0.045 and $0.050. This could happen if the broader market turns sour or if adoption of AIOZ’s node incentives and AI compute services takes longer than expected.
- Neutral-Reversal scenario: If price manages to hold above $0.060 and buyers start stepping in around these levels, we could see a bounce toward $0.080 to $0.085. That resistance zone might put a cap on gains unless there’s some positive catalyst—like a new partnership or expanded use cases—to push things higher.
- Bullish / Long-Term scenario: Assuming AIOZ keeps delivering on their roadmap (AI marketplace, compute services, DePIN node expansion), there’s a decent chance we could see a retest of around $0.12. Looking further out—maybe one to two years—and assuming the broader crypto market cooperates, some analysts are floating targets of $0.30 or even higher. Of course, this all depends on execution and whether tokenomics play out favorably.
Trading Strategy Suggestion: Your best bet is probably to look for entry points near that support zone (around $0.060 to $0.065) with a tight stop-loss if things drop below that range. Wait for some confirmation—maybe a bullish MACD crossover or a pickup in volume. If you’re thinking longer-term, accumulating in this zone while keeping an eye on upcoming upgrades and adoption metrics could offer a decent risk-reward setup.
Final Insight: Balancing Risks and Opportunity
AIOZ is positioned at the crossroads of some genuinely exciting tech trends—decentralized AI compute, permanent data storage, streaming infrastructure—and they’ve shipped real upgrades that add tangible value. The technicals show the asset is oversold, but there just isn’t enough volume or momentum yet to trigger a clear reversal. Everything hinges on whether that $0.060 support level holds. If it does, a recovery toward mid-resistance (around $0.085) looks doable. If it breaks, we’re probably looking at downside toward $0.045.