Recent Catalyst Events & Network Fundamentals
AIOZ Network has been quietly making some interesting moves in the decentralized AI and streaming infrastructure space. The team rolled out a major hardfork (v1.8) in late 2025 that improved the Layer-1 blockchain’s security and processing power—basically making it better equipped to handle demanding workloads. They also launched AIOZ AI, which is essentially a marketplace where developers can host AI models, sell datasets, and tap into on-chain computing power. Pretty cool stuff if you’re into the DePIN narrative. They’ve even been running developer contests like the Face Anti-Spoofing challenge to get more people building on the platform. On the tokenomics side, they’re working to cut annual inflation down to around 5% by 2026 and adding some deflationary mechanisms based on network revenue. So while the market’s been rough, the fundamentals are actually looking stronger.
Current Technicals & Key Levels
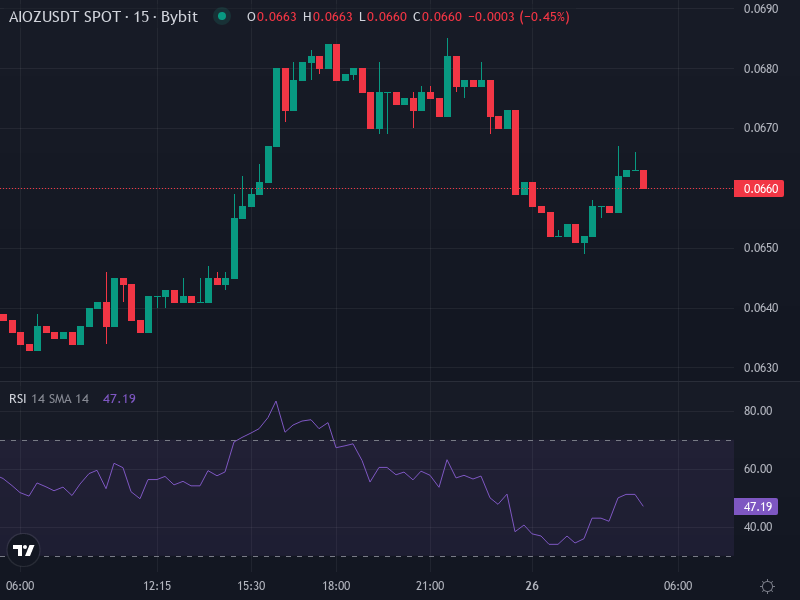
Right now, AIOZ is trading at roughly $0.066 (to be exact, $0.065868), which is up about 3.84% in the last 24 hours. That sounds good on paper, but the technical picture is honestly pretty mixed—leaning bearish if we’re being honest. Most moving averages across the board (5-day, 10-day, 20-day, 50-day and beyond) are flashing “Sell” signals on the daily chart, with price sitting below some important averages like the 50 and 100-day lines. The RSI is hovering in the mid-40s, which isn’t screaming oversold but definitely shows some weakness. The MACD and ADX aren’t giving us much direction either—ADX shows moderate trend strength but nothing’s really crossing over to hint at a reversal. Looking at the pivot points, support is sitting very close to current price around $0.06651 and $0.06484, with resistance up near $0.07399–$0.07857.
Support Zones
The nearest support zone we’re watching is between $0.064 and $0.066. If that doesn’t hold, there’s another level around $0.0615 that could catch the price. These are the spots where buyers typically show up, so they’re worth keeping an eye on. If we break below $0.061, things could get ugly fast and we might see a deeper pullback.
Resistance Areas
On the flip side, resistance kicks in around $0.074–$0.075. If AIOZ manages to push through that area with solid volume, we could see it climb toward $0.080-$0.085. But here’s the thing—that resistance has been pretty stubborn historically. Without some major news or a broader crypto market rally, breaking through might be tough.
Price Prediction Scenarios Based on Indicators
Let’s walk through a few different scenarios based on what the charts and fundamentals are telling us right now.
Bearish Base Case
If AIOZ can’t hold above that $0.064 level and starts sliding, we’re probably looking at some sideways action between $0.055 and $0.060 for the next few weeks. If the oscillators stay flat or head south—think RSI dropping below 40 or MACD going negative—that weakness gets confirmed. Any bounces in this scenario would probably run into a wall around $0.070–$0.075 before rolling over again.
Neutral Recovery Case
Now, if buyers step in and defend the current support and price manages to climb back above those short-term moving averages (especially the 50-day), we could see a decent run up toward $0.080. Volume is going to be the key here—we need to see participation pick up to confirm any breakout is real. RSI climbing into the 50-60 range with a positive MACD crossover would be encouraging signs. If that plays out, resistance around $0.085 becomes the next target over the next month or two.
Bullish Breakout Case
For AIOZ to really take off and break above $0.085 heading toward $0.10 or higher, we’d need something big—maybe a major partnership announcement, significant node adoption, or just a strong crypto market rally lifting all boats. Technically, you’d want to see price clearing the 100-day EMA, RSI pushing into the 70s, and sustained positive MACD momentum. Not gonna lie, this scenario feels less likely in the near term given where things stand right now, but stranger things have happened in crypto.
Investment Implications & Strategic Outlook
If you’re trading short-term, the $0.064–$0.066 support zone is crucial to watch. Losing that level could mean more pain ahead. On the upside, that $0.074–$0.075 resistance is the line in the sand—a clean break above it with good volume could really shift the mood. For long-term holders, the recent upgrades and the whole DePIN plus AI marketplace angle actually add real value to the project. The price might not reflect that yet, especially until we see serious adoption or the broader market cooperates, but the fundamentals seem to be building toward something. That said, it’s still risky until we get clearer signals that the trend is actually turning around.