
Recent Developments and Market Sentiment
MOVE is currently trading at around $0.03842, up roughly +2.31% over the past 24 hours. While this small uptick shows some buyers are stepping in, the bigger picture for MOVE is still clouded by past controversies, ongoing governance issues, and concerns about token supply. Earlier in 2025, things took a serious turn for the worse when Coinbase decided to suspend MOVE trading altogether. The exchange cited non-compliance with their listing standards after an internal probe uncovered sketchy market-making arrangements. Apparently, a large player—possibly Web3Port or a related entity—was able to control and dump massive amounts of MOVE tokens, which naturally led to accusations of manipulation and insider shenanigans. Since then, the project has been scrambling to clean up its act with token buybacks, setting up a strategic reserve, and even suspending co-founders. Add to that some hefty token unlocks and leadership changes, and it’s no wonder investor confidence remains shaky and volatility stays high.
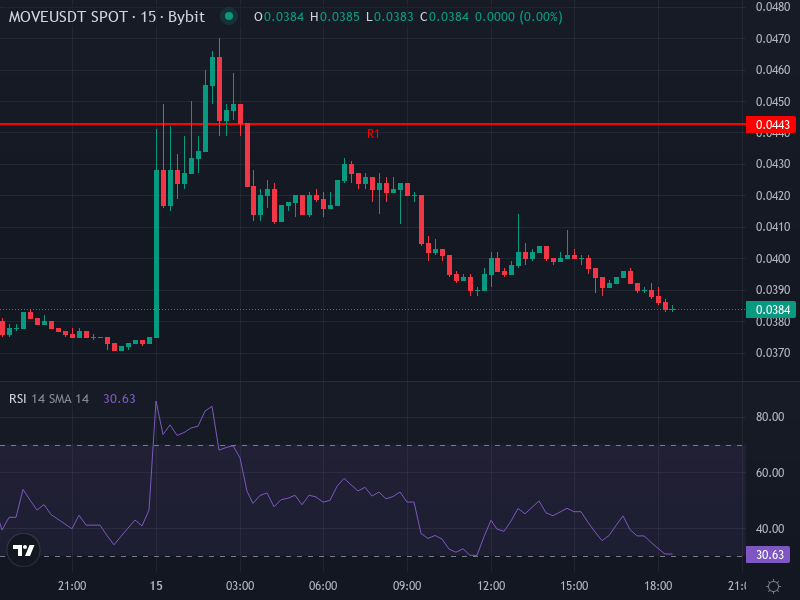
Technical Indicator Overview
Looking at the 4-hour chart for MOVE/USDT, the RELATIVE STRENGTH INDEX (RSI) is sitting around 55.6. That’s mildly bullish territory—momentum is building, but we’re not in overbought zone just yet. The MACD recently crossed above its signal line, which is usually a good sign if it’s backed up by solid volume. On the moving average front, the 4-hour SMA is around $0.03605 and the EMA is near $0.03705, both sitting below the current price. This alignment suggests we might be heading toward a bullish crossover, at least in the short term.
Zooming out to the daily pivots, resistance levels to watch are R1 at roughly $0.04427, R2 around $0.05013, and R3 near $0.05357. On the downside, support zones (S1 through S3) range from about $0.0350 down to around $0.0257. Interestingly, the daily rate-of-change (ROCP) is slightly negative, meaning despite today’s gains, there’s still some retracement happening on the bigger timeframe. Basically, intraday strength is there, but the overall trend is still under pressure.
Price Prediction: Scenarios & Targets
Scenario A: Bullish Continuation
If MOVE manages to stay above those 4-hour moving averages—around the $0.0370 mark—and the MACD stays positive with decent volume coming in, we could see a push toward the first resistance pivot near $0.0443. If that level breaks cleanly, the next stop would be R2 around $0.0501, with an optimistic stretch target up near $0.055 if everything lines up perfectly. For this bullish scenario to play out, though, we’d need to see real progress on the fundamentals—things like staking going live, more developers building on the platform, and clearer, more trustworthy communication from leadership.
Scenario B: Bearish Pressure Persists
On the flip side, if MOVE can’t hold that $0.0365 to $0.0370 zone, we’re likely looking at a test of support around $0.035. If that cracks, things could get ugly fast, with the price potentially sliding toward the daily S2 level near $0.0315, and in a worst-case scenario, down to S3 around $0.0257. Catalysts for this bearish move could include those large token unlocks hitting the market, fresh governance drama, or another exchange making unfavorable moves regarding MOVE. Until there’s real relief on the supply side or a major positive development, bearish momentum on the daily chart would likely keep the pressure on.
Key Variables to Watch Going Forward
- Token Unlocks & Supply Influx: Any scheduled token unlocks will flood the market with more supply, which typically pushes prices down unless there’s strong demand or mechanisms like burning or staking to absorb the extra tokens.
- Ecosystem Utility Deployment: Real adoption matters. Watch for progress on Move 2.0, LayerBank integration, staking features, and actual DeFi applications. Without utility, this remains pure speculation.
- Governance & Regulatory Clarity: The project desperately needs transparency—clean contracts, resolution of the market-maker mess, and stable leadership. Any more scandals or regulatory issues will hit the price hard.
- Volume & Exchange Activity: Strong, sustained volume with smart money accumulating could signal a bottom is forming. But watch out for large transfers to exchanges or announcements about limit-only trading—those are red flags that usually precede price drops.