
Introduction & Recent Ecosystem Developments
Linea is a zkEVM-based Layer-2 scaling solution built by Consensys, and it’s been through quite a ride since its token launched back in September 2025. What makes it stand out from other Ethereum Layer-2s are its deflationary features—it burns 20% of ETH gas fees and a whopping 80% of transaction fees paid in LINEA tokens. Recently, SharpLink Gaming made waves by deploying institutional ETH treasury capital onto the network, which has helped boost both credibility and total value locked. That said, things haven’t been all smooth sailing. Large token unlocks, concerns about distribution, and selling pressure after the airdrop have created plenty of volatility and pushed the price down. Right now, Linea is trading around $0.00642, down about 2.7% over the past day, and all these dynamics are shaping the current technical picture.
Current Technical Indicators & Short-Term Outlook
Looking at the 4-hour chart for LINEA/USDT, the Relative Strength Index is sitting at roughly 35.7. This means the token is getting close to oversold territory, though it’s not quite there yet—which could set up a potential bounce in the near term. The 4-hour MACD is showing negative momentum, with the MACD line sitting below the signal line and the histogram showing a slight expansion on the downside. While bearish pressure is definitely still present, there are hints it might be starting to lose steam.
Both the Simple Moving Average and Exponential Moving Average on the 4-hour timeframe are hovering around $0.006696, which is above where we’re trading now. This gap tells us that bears are still in control for the short term. For bulls to gain any traction, the price really needs to climb back above that EMA/SMA zone—that would be the first sign of a momentum shift.
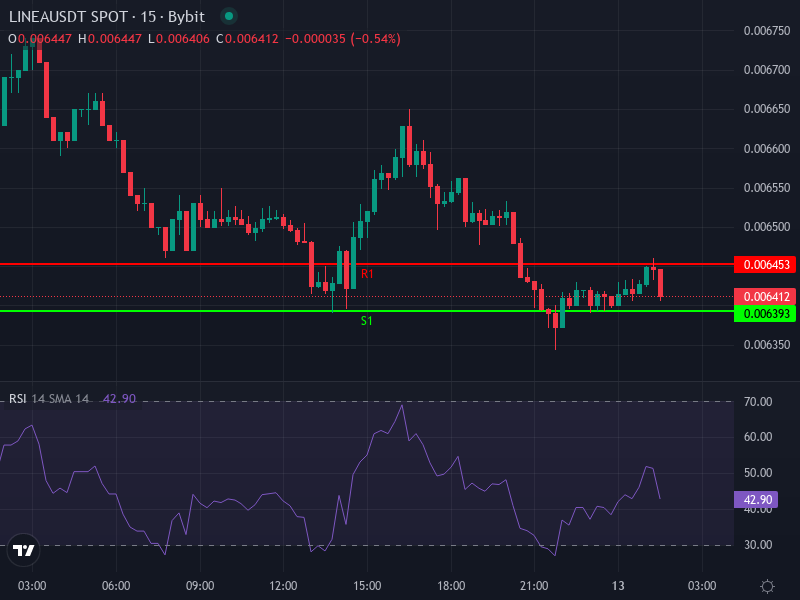
Support and Resistance Grid
The daily pivot levels give us some concrete zones to keep an eye on. On the resistance side, we’re looking at around $0.006453 for the first level, then $0.006486 for the second, and $0.006513 for the third. Support zones drop down to $0.006393, then $0.006366, and finally $0.006333. If price manages to decisively break above that first or second resistance area, we could see a short squeeze pushing toward the higher levels. On the flip side, if it drops toward the second or third support without any solid volume backing it up, we might see the downtrend accelerate.
It’s worth noting the impact of recent token unlocks—around 1.38 billion LINEA hit the market on January 10, 2026—which has added significant near-term supply pressure. That’s a bearish headwind for bulls unless we see demand pick up substantially. Breaking cleanly above $0.00670 might take several attempts without strong buying interest coming in.
Mid- to Long-Term Projections & Key Catalysts
If Linea can stabilize above its daily pivot around $0.0064267 and push through the second resistance near $0.00649, we could see it test a zone between $0.00670 and $0.00720. Getting there would require some serious catalysts though—think increased TVL growth, major partnership announcements, or institutional staking deployments to keep the momentum going. The SharpLink ETH deployment and those SWIFT pilot tests are exactly the kind of developments that could fuel this upside scenario.
On the bearish side, if supply pressure keeps building—whether from more token unlocks, disappointing burn metrics, or just general risk-off sentiment across altcoins—Linea could slide toward and potentially breach that second support around $0.006366 or even the third near $0.006333. A break below $0.00630 would be a real confidence killer and likely shift targets down toward $0.00600 or lower. Broader macro headwinds like interest rate decisions or regulatory uncertainty in crypto could make the downside risk even worse.
What would tip the scales toward a structurally bullish setup? We’d want to see trading volume picking up consistently over 24-hour periods, sustained ETH gas usage on the Linea network, transparent reporting on how much is actually being burned through fees, and clear evidence that those unlocked tokens are being absorbed into the ecosystem rather than dumped on the market.
Potential Scenarios
Bull Case: A break above $0.00650 could lead to a retest of the $0.00670-$0.00720 range, especially if backed by strong volume. Key triggers would be institutional adoption picking up, ecosystem grants being announced, and reassurance that the token unlock flow is manageable.
Bear Case: Getting rejected near $0.00645 could send price tumbling toward $0.00630 or lower. Further unlocks or weak burn data would likely extend the downside and keep pressure on the token.