Recent Developments & Fundamental Drivers
Following Ethereum’s Fusaka hard fork that went live on December 3, 2025, ssv.network has found itself at center stage. The upgrade brought EIP-7594 (PeerDAS) into play, allowing validators to work with smaller chunks of Layer-2 data blobs instead of downloading everything. This significantly eases the bandwidth and storage load for distributed validator technology (DVT) providers like SSV. The fork also bumped up gas limits through EIP-7825 and EIP-7935, tightening computational efficiency while pushing overall network throughput higher. These improvements strengthen SSV’s role in Ethereum’s scaling infrastructure.
On the flip side, September 2025 brought a sobering reminder of operational risks. A mass slashing event hit 39 validators running on SSV’s protocol, exposing how infrastructure problems at third-party staking providers can snowball into real losses—even when the protocol itself stays secure. Each validator lost roughly 0.3 ETH, which sounds small but raised important questions about reliability. The incident emphasized that maintaining rock-solid operations is critical for keeping trust in SSV’s value proposition.
Key Technical Indicators & Price Action
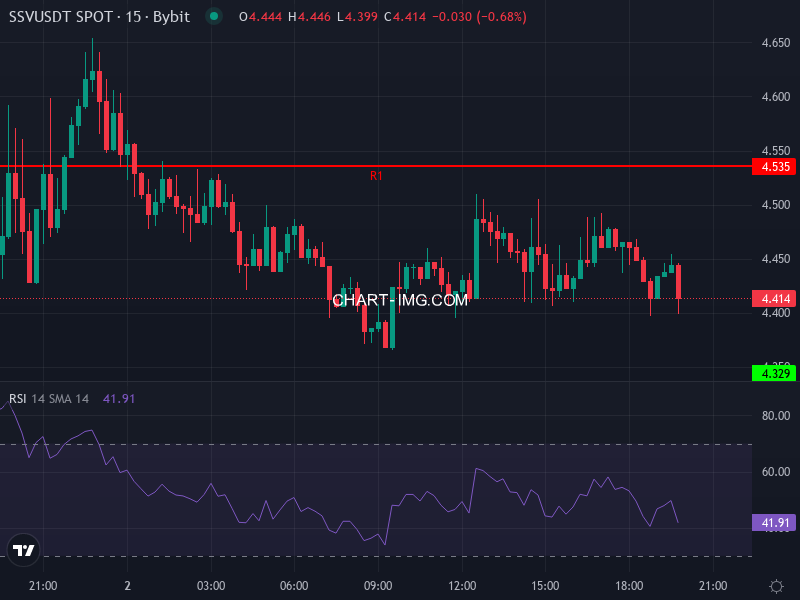
Right now, SSV/USDT is hovering around $4.44, down about 2.24% over the past day—showing some short-term pressure. Looking at the 4-hour chart, the Relative Strength Index is sitting at roughly 68, which suggests decent momentum but we’re edging toward overbought levels. The MACD has recently crossed bullish, with the line at about 0.152 versus the signal at 0.115, giving us a positive histogram that points to building momentum. The 4-hour simple moving average sits around $4.049 and the exponential moving average near $4.119—both trailing below current price, hinting at a short-term upward drift.
For daily pivot points, we’re looking at a pivot near $4.4497. Resistance zones line up at R1 around $4.5353, R2 at $4.6557, and R3 near $4.7413. On the support side, S1 comes in at approximately $4.3293, S2 sits near $4.2437, and S3 drops to around $4.1233. If price can’t hold $4.44, that first support level might catch sellers. A break below $4.24, though, could open the door to testing those lower levels where buyers were previously active.
Price Forecast: Scenarios & Medium-Term Projections
When we blend the technical picture with fundamental catalysts, two main scenarios stand out for SSV over the coming months:
-
Bullish Scenario:
If SSV manages to stay above $4.44 and punches through resistance in the $4.55–$4.65 zone with solid volume behind it, we could see a push toward $5.00. The long-term benefits of the Fusaka upgrade—cheaper validator operations and expanding Layer-2 activity—provide nice tailwinds for this outcome. -
Bearish Scenario:
If price slips below $4.33 support and can’t reclaim the pivot, we’re probably looking at a pullback toward $4.00 or lower. Add in broader altcoin weakness or another validator incident, and we might see things accelerate down into the $3.50-$3.70 neighborhood.
Looking ahead toward the middle of 2026, various forecasting models put SSV somewhere in the $5.50-$8.50 range under optimistic conditions, fueled by rising demand for staking infrastructure, more validator adoption, and Ethereum’s expanding rollup ecosystem. Taking a more cautious view, SSV might trade sideways in the $3.50-$5.00 zone, particularly if macro uncertainty or regulatory friction dampens appetite for risk assets.
Supportive Metrics & Final Insights
In the near term, keep an eye on a few key metrics: Ethereum’s blob usage across Layer-2 rollups (which tells us about transaction demand), growth in validator numbers and staking volume through SSV’s DVT, and whether SSV-based providers beef up their infrastructure after those slashing events. It’ll also be important to watch whether SSV holds above its short-term moving averages—the 50-day EMA and 4-hour SMA. Losing those tends to trigger deeper pullbacks.