Recent Developments and Market Backdrop
Momentum (MMT) has exploded onto the scene as one of the hottest tokens in late 2025, driven by its massive Token Generation Event on November 4, 2025, and listings on major exchanges like Binance, KuCoin, and OKX. The hype pushed the token’s price past $4 at its all-time high, but reality set in quickly—MMT tumbled nearly 70% as the initial speculation cooled off. Still, the project has some serious backing going for it, including heavy-hitters like Coinbase Ventures, OKX Ventures, and Jump Crypto. Plus, its buyback program tied to a ve(3,3) governance model has given the project more credibility despite the wild price swings.
Right now, the Sui-based ecosystem is holding nearly $600 million in Total Value Locked (TVL), and cumulative DEX trading volume has blown past $25 billion. These numbers back up the story around deflationary pressure from buybacks rewarding long-term stakers. That said, there’s a dark cloud on the horizon—token unlocks scheduled for 2026 could dump serious selling pressure on the market.
Technical Analysis: 4-Hour Chart Indicators
Let’s dig into the 4-hour chart readings for MMT/USDT, with the current price hovering around $0.23119. Here’s what the indicators are telling us:
- Relative Strength Index (RSI-4h): ~52.0 — Pretty neutral here, leaning slightly bullish but nowhere near overbought. The momentum is gentle, not screaming in either direction.
- MACD (4h): The MACD line just crossed above the signal line, creating a tiny positive histogram (~+0.0000418). This hints at some emerging bullish momentum, though it’s still pretty weak.
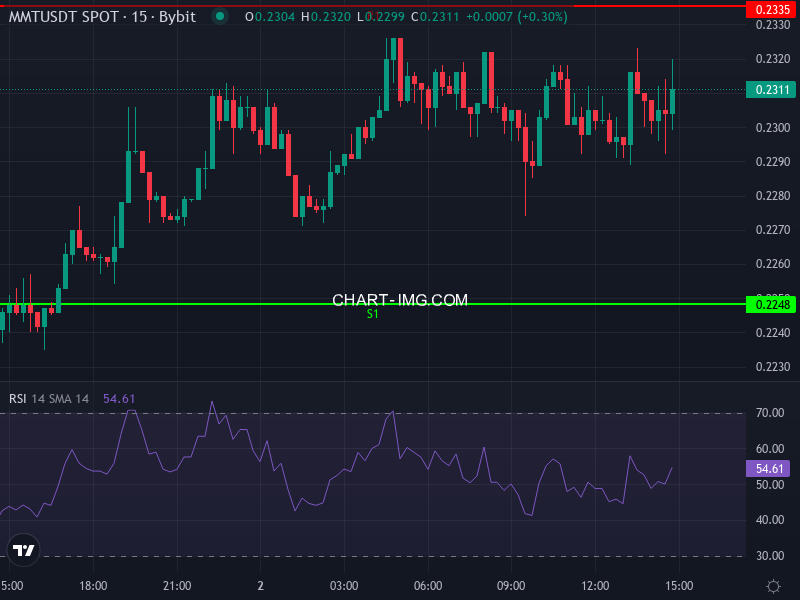
- Simple Moving Average (SMA-4h): ~ $0.23008 — The price is trading just above this short-term average, which could act as support if we dip.
- Exponential Moving Average (EMA-4h): ~ $0.22863 — This one’s sitting a bit lower, adding another layer of support. Price staying above both averages is a good sign.
Looking at the daily pivot levels based on recent price action, here’s what we’re working with:
- Pivot (central): ~$0.22847
- Resistance 1 (R1): ~$0.23353
- Resistance 2 (R2): ~$0.23717
- Support 1 (S1): ~$0.22483
- Support 2 (S2): ~$0.21977
These levels show us that any move up will likely hit a wall around $0.2335–$0.2372, while downside has cushions near $0.2248 and stronger support around $0.22 if things turn south. The 24-hour gain of roughly +3.25% suggests buyers are trying to take control, though there’s still resistance overhead.
Price Prediction Scenarios for Short-to-Mid Term (1-3 Weeks)
Bullish Scenario: Sustained Upside Push
If buyers can keep things afloat above the current 4-hour SMA/EMA support zone (~$0.228–$0.230), and the MACD starts building real momentum (with that histogram widening), MMT could test the first resistance around ~$0.2335, then possibly push toward R2 at ~$0.237. Breaking through ~$0.240–$0.245 would open the door to targets around $0.260–$0.280, though the old ATH near $4 is still a pipe dream unless the entire market flips bullish. This upside scenario really depends on the protocol keeping revenue strong, buybacks working their magic, and those nasty unlocks not killing the vibe. Also, the overall health of DeFi and the Sui ecosystem will play a big role.
Bearish Scenario: Loss of Support and Pullback Risks
If the price slides below the immediate support at the EMA/SMA (~$0.228), we’re probably looking at a drop toward the daily S1 at ~$0.2248. Break below ~$0.22 and things could get ugly fast, testing S2 support near ~$0.2198, potentially dragging us down toward ~$0.20. The real danger zone is those unlock events—if big chunks of MMT hit the market in early 2026 without enough buybacks or staking lockups to absorb them, the downside could get nasty. And let’s not forget, if the broader crypto market catches a cold because of regulatory issues or macro headwinds, MMT won’t be immune.
Near-Term Strategic Considerations for Traders and Holders
For traders, keep your eyes glued to daily volume and buyback activity—a surge in buybacks or fee generation could be the spark for another rally. It’s also worth watching the RSI on higher timeframes (daily or 12-hour) for overbought/oversold signals, and tracking MACD crossovers beyond the 4-hour chart to confirm trend shifts. For holders, the veMMT staking incentives and lockup options matter a lot—locking in for the long haul might improve your risk/reward profile if they can manage that unlock pressure properly.
Bottom line: MMT is sitting in cautiously bullish territory as long as it holds that $0.228 to $0.230 support zone. The $0.237 to $0.240 range is the next major test on the upside. If support fails, we could easily see a drop toward $0.22 or lower. Given MMT’s history of wild swings, keeping tight risk management (stop-losses or position scaling) is absolutely essential.