
Recent Developments and Fundamentals Driving Price Dynamics
Berachain’s tokenomics and ecosystem activity paint an interesting, if somewhat complicated, picture right now. Here’s the thing that has a lot of people worried: there are some pretty substantial token unlocks coming down the pipeline. We’re talking about roughly 84 million BERA tokens earmarked for core contributors and another 171.5 million or so reserved for investors—all of which stay locked until Q1 2026. After that, everything gets released gradually over the following two years. That kind of supply increase can really put downward pressure on prices unless demand picks up enough to absorb it. On the flip side, the Proof-of-Liquidity V2 upgrade has thrown some attractive yield incentives into the mix for people staking BERA, which could bring in more buyers looking for returns. Still, anyone who’s been around crypto for a while knows that vesting schedules and unlocks tend to create volatility and make prices jump around more. As far as the ecosystem goes, DeFi activity has been picking up steam—platforms like Kodiak and BEX are seeing decent growth—but investors are still being pretty cautious, mostly because of how past airdrops have played out and lingering questions about what the free float will look like down the road.
Price Action & Key Technical Indicators
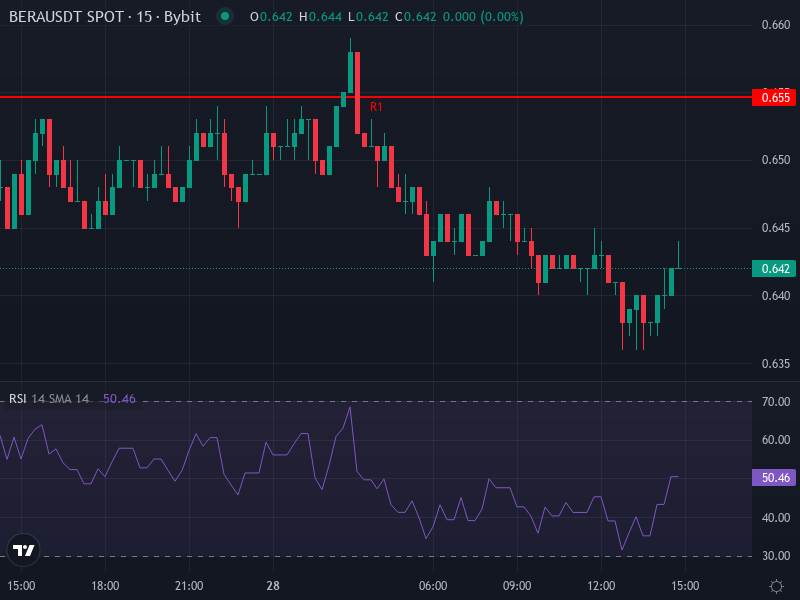
Looking at where BERA/USDT sits right now (trading around 0.6414, down about 0.73% over the past day), here’s what the charts are telling us for the near to medium term:
- 4-Hour RSI: The Relative Strength Index on the 4-hour chart is hovering around 57.1, which puts it right in that neutral zone—neither overheated nor oversold. When RSI hangs out between 50 and 60 like this, it usually means the price is consolidating and could break out in either direction.
- MACD (4-Hour): The MACD line is sitting at roughly 0.01104, just a hair below the signal line at 0.01130, which gives us a slightly negative histogram. This hints that momentum might be losing a bit of steam, though it’s not screaming bearish just yet.
- Moving Averages (4-Hour): Both the simple moving average (around 0.6211) and exponential moving average (about 0.6274) are sitting below the current price, which suggests there’s some short-term upward bias. That said, the price is still close enough to these averages that we could easily see false breakouts.
- Daily Pivot Levels: On the resistance side, we’ve got R1 around 0.6547, R2 at 0.6673, and R3 up at 0.6767. For support, we’re looking at S1 around 0.6327, S2 at 0.6233, and S3 down at 0.6107. If we see a solid close above R1, that could signal a move toward those higher resistance zones. But if price drops below S1, things could get dicey pretty quickly.
- Rate of Change (Daily ROC-P): The daily rate-of-change is showing about +0.1694, which points to some recent upward momentum. But honestly, it’s not exactly explosive growth, and that momentum could easily reverse if sellers start pushing harder near resistance levels.
Projection Scenarios: Where Could BERA Move From Here?
Bullish Case
If things go well—meaning staking yields stay attractive (think above 10%), DeFi volume continues growing, and community enthusiasm picks back up—BERA could definitely challenge those resistance levels we mentioned. Breaking through that daily resistance around 0.6547 would be the first hurdle, potentially opening the door to R2 around 0.6673. If that momentum really gets rolling, we might even see R3 at roughly 0.6767. A clean push past 0.68 could really open things up, possibly taking the price back toward the $0.75 range, especially if the broader crypto market cooperates.
Neutral / Consolidation Case
If buyers and sellers basically cancel each other out, which honestly seems pretty likely right now, BERA will probably just bounce around between support at roughly 0.6327 and resistance around 0.6547. We might see some volatile dips down to S2 around 0.6233 during choppier sessions. The technical indicators—like that flat-lining MACD and neutral RSI—really support the idea of sideways or mildly upward movement unless something major happens to shake things up.
Bearish Case
Now, if things take a turn for the worse—maybe those token unlocks hit harder than expected, overall market sentiment sours, or broader economic concerns creep in—BERA could definitely slip below S1 at 0.6327. From there, the next support to watch would be S2 around 0.6233, and if selling pressure really intensifies, we could even see S3 around 0.6107 come into play. The MACD divergence and any failure to close above pivot resistance would make that downside risk even more likely.
Short- and Mid-Term Price Prediction
Taking everything into account—both the on-chain fundamentals and what the technical indicators are showing—here’s what seems most probable:
- Next 1-2 Weeks: We’re probably looking at a range between roughly $0.62 and $0.66. There’s a slight bullish tilt if that resistance around $0.655 gets tested and holds, but we really need to see a clear breakout above that level for any meaningful upward movement.
- Next 1-3 Months: If staking adoption keeps increasing and those upcoming unlocks don’t completely flood the market, the price could realistically push toward $0.75. In a more neutral scenario, we’d probably see it trade within a $0.60 to $0.70 range. On the bearish side, if major resistance levels fail and supply pressure builds, we could see things drop toward $0.55.
At the end of the day, where BERA goes from here really comes down to supply dynamics, how attractive those staking returns remain, and whether the market can absorb those upcoming token unlocks without major sell-offs. Traders should keep a close eye on how daily candles react at resistance levels, any announcements about staking APRs, and how price behaves around those pivot points—those are going to be your best clues for figuring out which way this moves next.