
## Recent Developments and Sentiment Context
Right now, YFI is trading at around **$3,360.20**, showing a small 24-hour bump of roughly 0.68%. This suggests the token has some relative strength compared to its recent volatility. Looking at the bigger picture, Yearn has been dealing with fallout from legacy smart contract exploits that came to light around mid-December. These raised concerns about security audits, though the active vaults weren’t actually affected. The result? A pretty mixed vibe in the community—people are relieved that the core platform is still secure, but there’s lingering worry about past vulnerabilities. On top of that, there’s a governance proposal floating around that could redirect a significant chunk of protocol revenue to YFI stakers. If that passes, it could really change the yield landscape and potentially ease some of the selling pressure.
From a technical standpoint, YFI seems to be trying to find its footing after some downtrends. That said, it’s still battling against long-term moving averages and some stubborn resistance zones that are making it tough for the price to rally hard.
## Technical Indicator Analysis & Price Structure
When we dig into the short- and mid-term momentum for YFI/USDT, here’s what stands out:
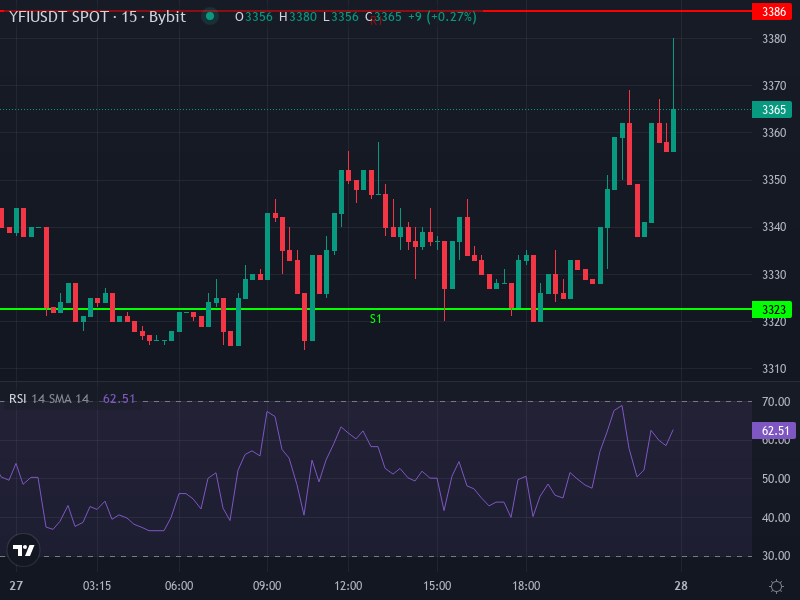
**4-Hour Timeframe:**
The RSI is sitting at about 53, which puts it in neutral territory—not overbought, not oversold. The MACD line is slightly above its signal line, and the histogram is showing a positive reading around +2.2, hinting at some early bullish momentum building. The 4-hour SMA (roughly $3,344) and EMA (around $3,345) are both sitting just below the current price of $3,360, which means they’re providing a bit of support in that zone.
**Daily & Longer Timeframes:**
Here’s where things get less encouraging. The price is trading below its major daily moving averages—the 20-, 50-, and 100-day marks—which tells us there’s still longer-term bearish pressure weighing things down. On the daily chart, the RSI is hanging out in the 35-40 range. That’s oversold territory, though not extreme, which sometimes sets up a short-term bounce if some buying volume comes in. ADX readings have been elevated, sitting in the mid-40s, which indicates a strong trend—unfortunately, that trend is currently pointing downward.
Support levels are clustering around $3,284.75, $3,231.09, and a stronger level near $3,157.98. Meanwhile, resistance is likely sitting around $3,411.52, $3,484.63, and further up near $3,538.30. The pivot point is roughly at $3,347.33.
### Short-Term Scenarios (Next 7-14 Days)
Given where things stand right now, we’re looking at two main possibilities for the near term:
- Bullish Bounce Path: If YFI can hold above the 4-hour moving averages around $3,344-$3,345 and the daily pivot near $3,347, momentum could carry it up to test resistance at roughly $3,411.52. A clean breakout there, backed by solid volume, might open the door to further resistance around $3,480-$3,540.
- Bearish Breakdown Risk: On the flip side, if the price dips below support around $3,284.75 and doesn’t quickly recover the pivot levels, selling pressure could really pick up. That might push YFI down toward $3,230, and in a worst-case scenario, even down to $3,158. If we see volume spike during these moves, momentum indicators could turn more decisively bearish.
## Medium-Term Outlook: Key Price Prediction Bands
Looking ahead over the next one to three months, considering the current structural weakness but also the potential for things to stabilize, here’s what seems reasonable:
- Base Case Projection: YFI probably trades in a range between roughly $3,150 and $3,550, bouncing around depending on broader crypto market trends, DeFi capital flows, and any surprises on the governance or security fronts.
- Optimistic Scenario: If those revenue-sharing proposals get approved, or if we see capital flowing back into DeFi as people hunt for yield, YFI could retest resistance around $3,500-$3,600. If a broader altcoin season kicks in, there’s even a chance it pushes toward $3,900. But that’s a big if—it would need to break through those long-term moving averages first.
- Bearish Scenario: Without positive catalysts, or if macro conditions get worse (think regulatory crackdowns, rising interest rates, or Bitcoin sucking up all the oxygen), the price could break below $3,150. From there, we’d be looking at deeper support around $2,800-$3,000 if the selling really accelerates.
The positive slope on the MACD histogram in the 4-hour chart suggests that short-term momentum is leaning bullish, but until the price actually climbs above those daily resistance zones and longer moving averages, the trend is still pretty fragile. Volume is going to be key here—if we see strong volume backing upward moves, that’s a good sign. If there’s no follow-through, we could be looking at bull traps.
**Final Insight:** YFI is sitting at a technical crossroads. It’s holding just above important support and pivot levels, which creates opportunity, but the downside risks are definitely real. If you’re trading conservatively, it might make sense to wait for confirmation above roughly $3,450 before jumping into new long positions. If you’re more aggressive, you might test support near $3,300-$3,200 and position cautiously for a potential rebound.