
Recent Market Overview and Fundamentals
Notcoin is currently trading around $0.00051903, with a modest 24-hour increase of about +1.5%. That said, the trading volume and overall momentum suggest that buyers aren’t exactly rushing in with conviction. With nearly all of its tokens already in circulation—roughly 99.4 billion out of a maximum 102.45 billion—there’s consistent selling pressure whenever demand softens. The market cap sits in the low tens of millions, and frankly, the broader altcoin market hasn’t been doing Notcoin any favors lately. Bitcoin dominance has been climbing, and the Fear & Greed Index has been trending downward, which typically means risk-averse sentiment across the board. On the fundamental side, Notcoin has been evolving beyond its original “tap-to-earn” gaming origins, adding features like community rewards, staking options, and deeper integration with the TON blockchain.
Technical Indicators & Chart Structure
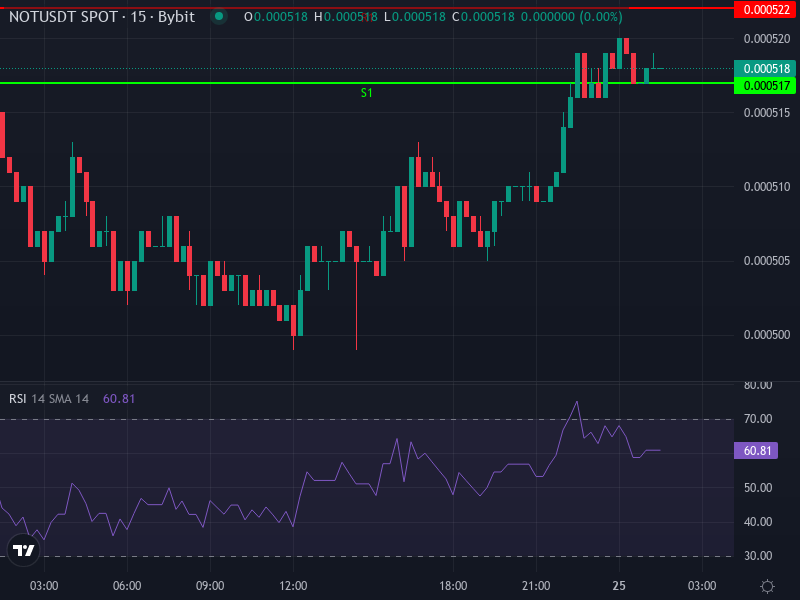
Looking at the technical picture, things appear mostly neutral with a bearish lean in the short to medium term. On the 4-hour chart, the RSI is sitting around 53.4—pretty much middle-of-the-road territory, neither oversold nor overbought. The MACD is showing the MACD line slightly above the signal line with a small positive histogram, which hints at potential stabilization rather than any strong momentum building. Both the simple and exponential moving averages on the 4-hour timeframe (SMA around $0.0005165 and EMA near $0.0005156) are just below the current price, potentially acting as support in this zone. Daily pivot analysis shows the pivot point at $0.0005190, with resistance clustering around $0.0005219-$0.0005240 and support levels down near $0.0005140-$0.0005119.
Support and Resistance Levels
The main support zones to watch are around $0.0005074, with additional floors at $0.0004982 and down near $0.0004866. On the upside, the first real resistance sits at $0.0005281, followed by stronger barriers around $0.0005398 and $0.0005489. If Notcoin can push past that ~$0.000528 level convincingly, it could open the door to testing those higher resistance areas. On the flip side, if it drops below ~$0.000507, we’d probably see sellers pushing it down toward ~$0.00048 or potentially lower.
Price Projection Scenarios
Given where the indicators are sitting and the supply dynamics at play, there are two main scenarios that seem likely to unfold over the next few weeks:
Scenario A: Bearish Continuation
If Notcoin can’t hold that ~$0.000507-0.000514 support zone—particularly if we see selling volume pick up—it would pretty much confirm that any recent rallies are running out of steam. In that case, we’d be looking at potential moves down to around ~$0.00048, or even testing ~$0.00045 if the broader market stays rough. Signs to watch for would include the MACD turning more negative and the RSI dropping below 40. In this bearish scenario, that ~$0.000528 level becomes a ceiling that caps any bounce attempts.
Scenario B: Recovery Uptick / Bullish Reversal Potential
On the other hand, if Notcoin manages to break cleanly above that ~$0.000528 resistance—especially with daily closes above the 7-day and 30-day EMAs—we might be looking at a genuine momentum shift. That would set up a potential retest of the ~$0.00054–$0.00055 area, and if market sentiment broadly improves, we could even see a push toward ~$0.00060. Confirmation signals would include the MACD line climbing above its signal with an expanding histogram, RSI moving into the 50-60 range, and decent volume backing the move.
Intermediate Forecast: 1-Month Outlook
Over the next month or so, assuming conditions stay relatively neutral, Notcoin will probably trade in a range between roughly ~$0.00050 and ~$0.00053. Sure, volatility might cause quick spikes or dips outside that range, but without some real fundamental catalyst or a major shift in altcoin sentiment, any breakout attempts will likely fizzle. A clean break above resistance or below support would be the technical signal we need to confirm which direction things are actually heading.
Implications for Traders and Investors
For short-term traders, tight risk management is the name of the game here—set stop losses below those support zones and consider taking profits at resistance levels. Given the high circulating supply and volatility, larger holders might want to wait for dips rather than chasing any pumps. If you’re thinking about a medium-term position, keep an eye on developments in the TON ecosystem or new integrations that might actually drive demand and utility. Without those kinds of catalysts, honestly, Notcoin looks more likely to consolidate or drift lower than to make any dramatic upward moves.