
Current Market Conditions & Recent Developments
ApeCoin is currently trading around 0.1950 USDT, down approximately -3.41% over the last 24 hours. Technical indicators and sentiment analysis are painting a pretty grim picture right now, with most sources labeling APE as a “Strong Sell.” Almost every moving average—whether you’re looking at short-term, medium-term, or long-term—is pointing down. The 50-day, 100-day, and 200-day Simple Moving Averages are all sitting well above the current price, which really hammers home just how strong the bearish momentum is.
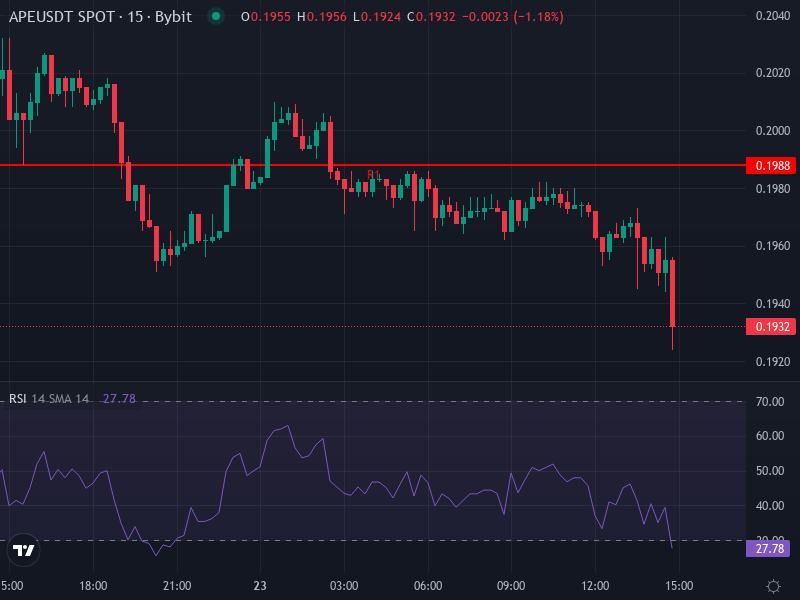
Things don’t look much better when you dig into the oscillators. The MACD is showing negative readings, with the MACD line below the signal line and the histogram trending downward. The RSI is hovering in the low 40s—just above oversold territory—which tells us that buyers aren’t exactly rushing in with conviction. Looking at daily pivot points, we’re seeing the pivot around 0.1955 USDT, with support levels at S1 (0.19), S2 (0.1867), and S3 (0.1812). On the flip side, resistance starts at R1 (0.1988 USDT) and climbs from there.
On the fundamental side, there really hasn’t been anything significant to shake up this bearish trend. News about ecosystem developments, marketing pushes, or regulatory changes has been pretty quiet. The broader market hasn’t been kind to altcoins lately, and without some positive catalyst—like favorable crypto regulations or exciting partnerships within the Bored Ape Yacht Club or Yuga ecosystem—the technicals are probably going to keep driving price action for now.
What Indicators Suggest Next Moves and Where Price Likely Lands
Short‐Term Projection (Next 5–14 Days): Since we’re right around that daily pivot support of roughly 0.1955 USDT, there’s a chance we could see a small bounce toward the 0.1985–0.2000 USDT resistance zone. That would be a modest 1–3% rebound if sellers start to lose steam around this support level. That said, the MACD histogram is still showing negative growth, and the 4-hour RSI is sitting around 34, which suggests momentum is pretty weak. If that support fails, we could be looking at further downside.
Mid-Term Projection (1–3 Months): Without any bullish news on the horizon, the most realistic scenario is that APE stays range-bound between roughly 0.18–0.20 USDT. If selling pressure picks up—maybe from broader market weakness or negative sentiment—we could see APE test lower support around 0.177–0.180 USDT. On the other hand, if price can break above the 50-day SMA at about 0.200 USDT, there might be a path toward 0.22 USDT. But honestly, with the current indicator setup, that seems pretty unlikely right now.
Risk Factors & Key Levels to Monitor
- Critical Support Zone: 0.190–0.1955 USDT. Losing this level would open the door to the next support tier around 0.181–0.1867 USDT.
- Resistance Zone: 0.1988–0.2043 USDT. There’s a cluster of moving averages in this range that’s going to make any upward reversal pretty difficult.
- Momentum Signals: The MACD is still bearish, and the RSI is weak. We might see some temporary oversold bounces, but don’t expect any real trend reversal without higher volume or positive news.
- Fundamental Catalysts: Things like new BAYC or Yuga Labs releases, protocol partnerships, or regulatory clarity could change the game. Right now, the lack of these catalysts is contributing to the price decline.
Projection Scenarios Based on Technical Inputs
Bearish Base Case (Likely): Price stays below the daily pivot and can’t reclaim the 50-day SMA. If the 0.195 support breaks, we’re probably heading toward the 0.181–0.1867 range over the next few weeks. The RSI might dip below 30 into oversold territory, but that doesn’t mean buyers will show up—we could just see extended consolidation or a slow grind lower.
Neutral to Slight Bullish Case (Less Probable): Price hangs around the pivot zone of 0.195–0.200 USDT and starts building some accumulation. If we see volume pick up, a breakout above 0.200–0.2043 USDT could test resistance near 0.2076 USDT. Any move above that would be a big deal and could signal a genuine sentiment shift, potentially pushing toward 0.22–0.23 USDT.
Final Insight
APE is definitely under serious bearish pressure right now. All signs point toward more support tests and potential breakdowns unless buyers suddenly appear. Keep a close eye on that 0.190–0.1955 USDT zone—if it holds, we might get a short-lived rebound, but if it breaks, we’re likely heading toward 0.181 USDT. Resistance between 0.1988–0.2043 USDT is going to be tough to crack. Unless something changes fundamentally, the current trajectory favors continued weakness and range-bound trading with a downward bias.