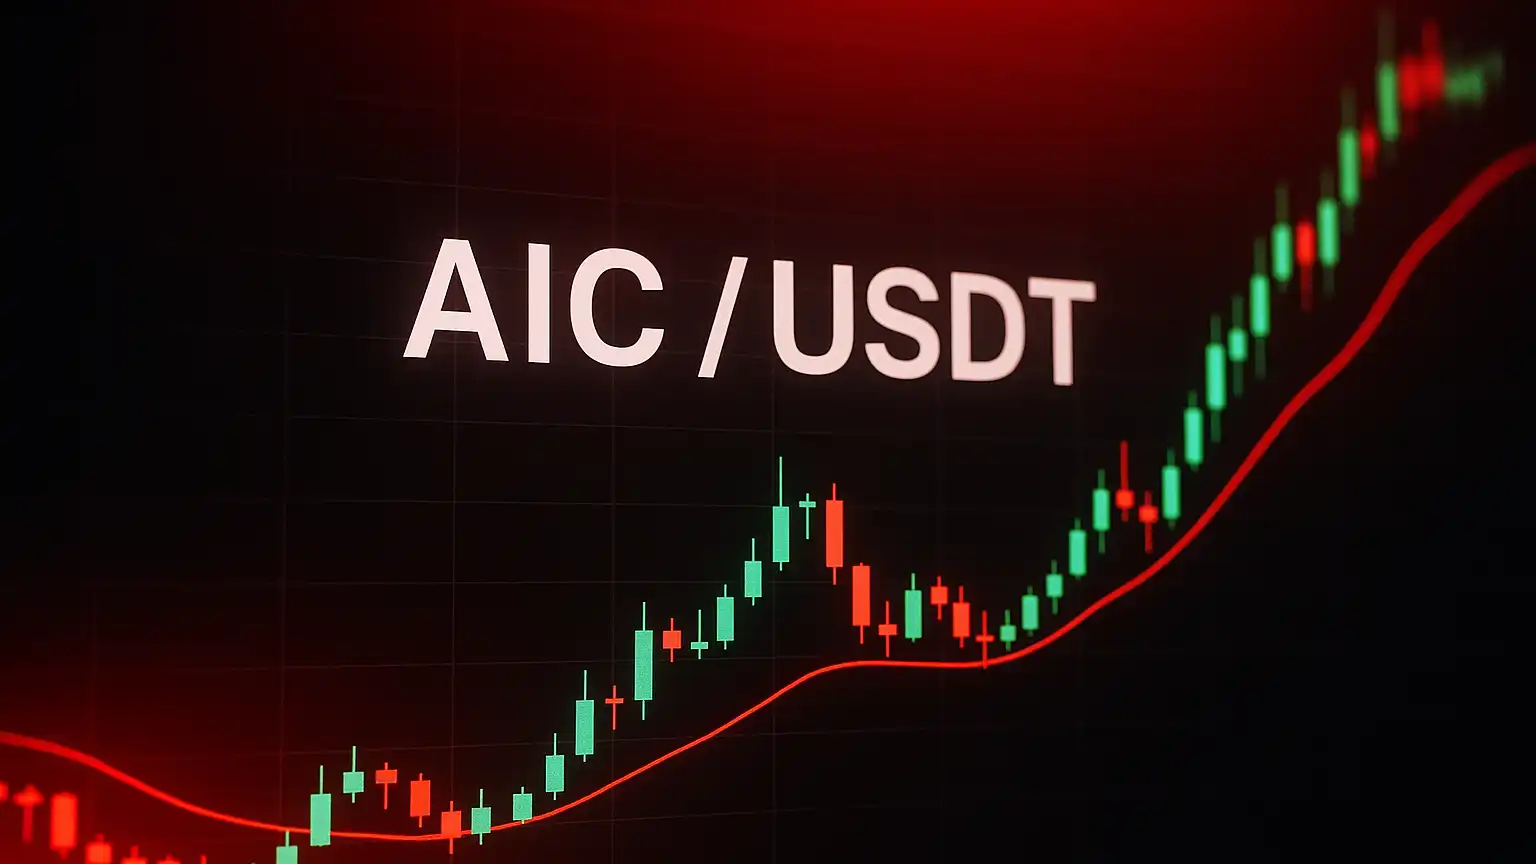
Current Market Dynamics and Fundamental Signals
AI Companions (Ticker: AIC/USDT) is currently trading around $0.08992, down more than 4.4% over the last day. What’s particularly concerning is the sharp drop in trading volume—we’re seeing a decline of roughly 39%—which suggests buyers are losing interest. Right now, AIC is sitting below its 50-day Simple Moving Average, which typically points to either bearish sentiment or a period of consolidation. The token is testing support zones while resistance levels continue to block any meaningful upward movement. Most technical indicators are flashing “Bearish” or “Strong Sell” signals on shorter timeframes.
Looking at the fundamentals, there’s actually some positive action happening with AIC’s tokenomics. The team has bought back over $5 million worth of tokens and burned approximately 15.8 million tokens as part of a committed $3 million campaign. These deflationary measures reduce the circulating supply, which could make the token more sensitive to any increase in demand. They’ve also formed partnerships with educational platforms that use AI tutors, adding some real-world utility to the project. That said, the broader AI token sector remains extremely volatile—these narrative-driven coins tend to experience sharp reversals whenever market attention shifts away from AI themes.
Technical Indicators: Chart Patterns, Trend Lines, and Momentum
From a technical perspective, AIC is currently trading below all its major moving averages—the 20-, 50-, 100-, and 200-day EMAs. This setup confirms a downtrend across multiple timeframes. The 14-day Relative Strength Index is hovering in the low-to-mid 30s, which means we’re not quite at oversold levels yet, but there’s definitely no bullish strength building. The Average True Range readings show increased volatility, so we should expect some larger intraday price swings in the near future. Recent candlestick patterns show more selling pressure than buying interest. Key resistance sits around $0.11-$0.12 (where recent retracement attempts peaked), while support zones cluster between $0.0729 and $0.0759. If those levels break, there’s a more critical floor waiting near $0.050.
Patterns & Trigger Levels for Reversal or Further Decline
If AIC manages to close above the $0.11-$0.12 resistance zone with strong volume backing it, we could see a move toward $0.15-$0.18, possibly even testing $0.20 and beyond. On the flip side, if the price can’t hold above $0.08, we’re likely headed down to test that $0.0729 base. Should that support fail under continued selling pressure, the next stop would probably be around $0.05—a psychological level that shows up as significant support on lower timeframes.
Multi-Horizon Price Predictions: Near-Term to Mid-Term Scenarios
Looking at various forecasting models, the consensus leans toward continued downward pressure over the coming weeks and months. Some models predict AIC could fall about 24-28% to roughly $0.0694 by mid-January 2026 if the bearish momentum continues. On the optimistic side, if AIC can break through resistance and benefit from broader sector strength, some projections suggest a range of $0.15 to $0.25 by late 2026. However, most longer-term forecasts extending to 2027-2030 keep expectations below $0.30 unless we see a dramatic acceleration in real-world adoption.
One important long-term factor is how effective the buyback and burn program will be. As supply shrinks, any revival in demand—whether from new exchange listings or expanded use cases—could lead to more significant percentage gains. The project’s future really hinges on maintaining an active community, developing practical use cases, and sustaining on-chain activity.
Trader Strategy Recommendations
– If you’re a conservative trader, it makes sense to wait for a clear break above the ~$0.11 resistance level with strong volume before considering long positions.
– More aggressive traders might look at accumulating between current levels and the ~$0.0729 support zone, but make sure to set tight stop-losses below that range.
– Short positions could be worth considering if AIC fails to reclaim the ~$0.08 level, with targets around $0.05-$0.06.
– For those thinking mid-term, keep a close eye on supply metrics, burn announcements, and any signs of major exchange activity or real-world partnerships. These catalysts could trigger longer periods of price discovery.