
Recent News and Context
MOVE token has been through quite a rollercoaster over the last few months. Back in March 2025, Movement Labs called out one of their market makers for breaking contract terms—basically dumping tokens without maintaining proper liquidity on both sides. Binance stepped in and removed that market maker, while Movement committed $38 million USDT to buy back tokens and create a Strategic Reserve. This move actually helped restore some confidence in the short term.
More recently, things got interesting again when Movement launched their Stable Protocol on mainnet December 8, 2025. This opened up cross-DeFi integrations and let anyone issue and redeem tokens permissionlessly. The very next day though, 50 million MOVE tokens were unlocked into circulation—and as we’ve seen time and again in crypto, these unlocks tend to bring heavy selling pressure.
Technical Indicators Analysis
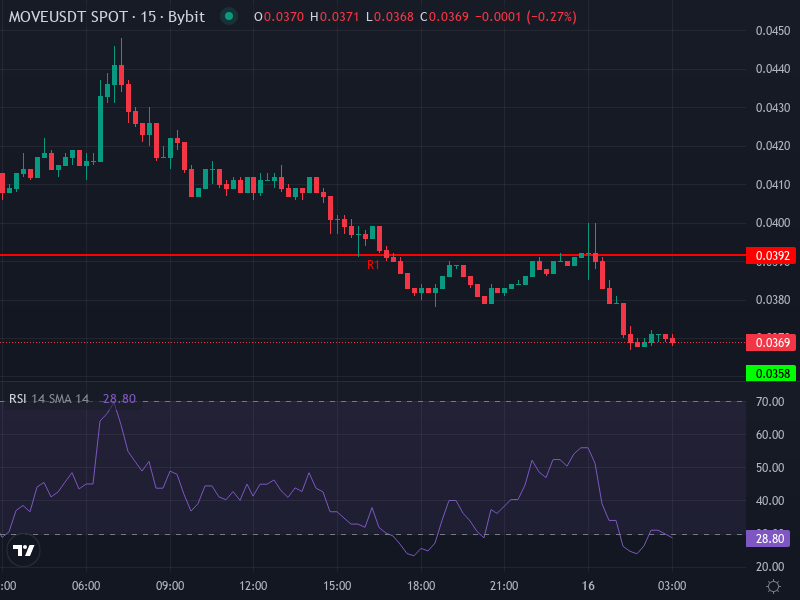
Right now, MOVE/USDT is sitting at around $0.03706, down over 9% in the last 24 hours. Those recent token unlocks are definitely weighing on the price. Looking at the 4-hour chart, the RSI is hovering around 38.4—getting close to oversold territory but still showing there’s downward momentum in play.
The moving averages aren’t looking great either. On the 4-hour timeframe, the Simple Moving Average is roughly $0.03962 and the Exponential Moving Average is about $0.04031. Since the current price is trading below both of these, we’re clearly in bearish territory. The MACD indicator backs this up too—the MACD line is sitting below the signal line with a negative histogram, which tells us bearish momentum will probably stick around for a bit.
Daily pivot points give us some useful reference levels to watch. Resistance sits at approximately $0.03917, $0.04133, and $0.04257, while support levels are down near $0.03577, $0.03453, and $0.03237. The main pivot point is around $0.03793. Since MOVE is trading below that pivot, it reinforces the bearish outlook unless we see a strong reversal soon.
Short-Term Prediction (Next Few Days – 1 Week)
Based on what we’re seeing right now:
- If the selling pressure keeps up, MOVE will likely test that first support level around $0.0358. If things get worse, we could see it drop to $0.0345 or even touch $0.0324.
- For any kind of bounce, the price needs to break above that pivot around $0.03793 first, then push through resistance near $0.0392. If that happens, we might see it climb back toward the $0.041–0.0425 range in a best-case scenario.
Volatility is running high thanks to those recent unlocks and broader market conditions. Keep an eye on volume spikes and any changes in the MACD or RSI—those could signal an early reversal.
Mid- to Long-Term Outlook (1-3 Months and Beyond)
Looking further out, MOVE has some challenges ahead, mainly around supply. Only about 22.5% of the total max supply is actually circulating right now. There are more unlocks coming from early backers, and history shows these tend to trigger some pretty sharp selloffs.
That said, there are some positive catalysts worth considering:
- The newly launched mainnet and stable protocol could drive real DeFi activity, which would increase actual utility and demand for the token within the ecosystem.
- If the broader altcoin market starts recovering—especially if Bitcoin dominance drops and macro conditions improve—MOVE could benefit from capital rotating into smaller cap altcoins.
Looking at different scenarios, most projections have MOVE trading somewhere between $0.030 and $0.050 over the next few weeks. There’s potential upside toward $0.055–$0.060, but only if demand really picks up and they can manage those supply pressures. Otherwise, we’re more likely to see it drift toward the lower end of that range.
Things to Monitor Closely
Keep tabs on these factors—they could really shift the picture:
- Upcoming token unlock schedules and how much of that supply ends up hitting exchanges.
- Mainnet adoption metrics like Total Value Locked and DEX trading volume in the Movement ecosystem.
- Technical signals like a MACD crossover or RSI dropping below 30 then bouncing back, which could indicate an oversold reversal.
- Broader market conditions including interest rates, regulatory news, Bitcoin dominance trends, and overall crypto market sentiment.