Recent Developments & Market Sentiment
Sahara AI has been making waves lately with some impressive moves on both the development and partnership sides. The big news? They’ve just struck a deal with AEON that lets people actually spend $SAHARA tokens at over 20 million merchants across Southeast Asia, Mexico, and Nigeria. That’s a pretty huge leap from being just another crypto token—now it’s got genuine real-world utility in emerging markets where adoption could really take off.
Back in late July, they launched their Data Services Platform (DSP), which is basically creating a decentralized AI gig economy. The response was immediate—contributors started earning rewards right away, and the platform handed out over $450,000 on day one alone. Since then, community engagement has stayed pretty strong.
But it hasn’t all been smooth sailing. Late November 2025 hit them hard with a brutal 50%+ drop in just a short period. The culprit? A combination of major token unlocks flooding the market and cascading liquidations from leveraged positions. The team confirmed there was no security breach, but they had to push back some major announcements while dealing with the aftermath.
Key Technical Indicators & Price Levels
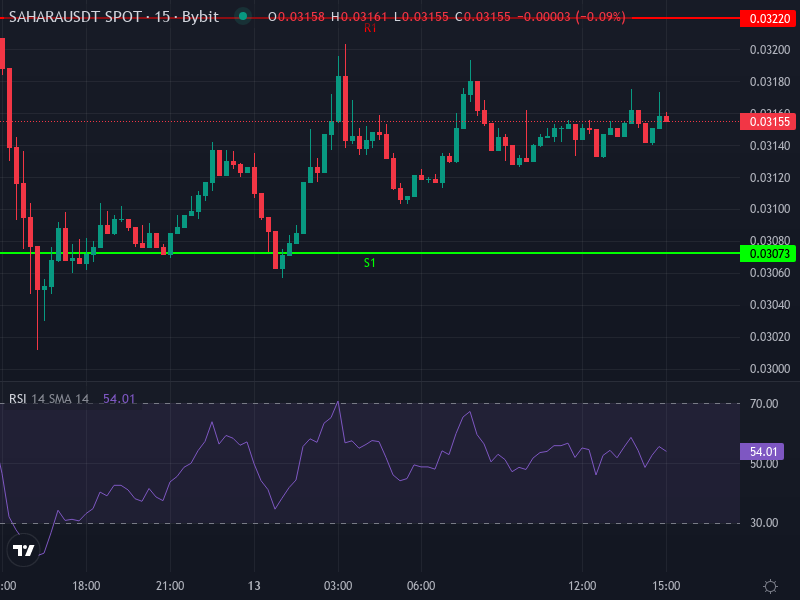
Right now, $SAHARA is trading around $0.03160008, and honestly, the short-term technicals aren’t looking great. The 4-hour RSI is sitting at about 36.4—not quite oversold territory yet, but definitely on the weaker side. The MACD just barely crossed positive on the 4-hour chart, which could be a small glimmer of hope, but both the Simple and Exponential Moving Averages are overhead around $0.03314–$0.03315, acting as resistance that’ll be tough to break through.
Looking at the daily pivot points, here’s what traders are watching:
- Resistance (R1): ≈ $0.03220
- Pivot (daily midpoint): ≈ $0.03136
- Support (S1): ≈ $0.03073, with deeper levels near S2 at ≈ $0.02989
The daily Rate of Change is showing approximately -19.65%, which is pretty brutal and confirms the strong bearish momentum we’ve been seeing.
Most technical summaries from various platforms are flashing “sell” signals right now—the 14-day RSI is stuck in the mid-40s, and pretty much every moving average across different timeframes is pointing down.
Price Prediction: Scenarios & Projections
Bullish Scenario: Reversal & Recovery Above Resistance
If things start to turn around—maybe the selling pressure from token unlocks eases up, or they announce something big like expanded AEON integration or a major enterprise partnership—we could see $SAHARA push back toward that $0.03314-0.03315 resistance zone. If it manages to convincingly break through the daily pivot and R1 around $0.03220, we might see it test the $0.03500 area. For this to happen though, we’d need to see momentum indicators flip bullish—MACD trending up and RSI climbing back above 50.
Bearish Scenario: Continued Downward Drift & Support Tests
On the flip side, if those token unlocks keep putting pressure on the price and the broader crypto market stays weak, $SAHARA will likely test that S1 support around $0.03070. If that level breaks, we’re probably looking at a slide down to S2 near $0.02989, or even S3 around $0.02925. These deeper levels line up with previous consolidation zones where bargain hunters might start stepping in—if you’re willing to take on the risk.
Risk Factors & Key Watchpoints
- Token unlock schedules are the elephant in the room—each one floods the market with new supply, and if you’re holding during one in a weak market, it’s going to hurt. Keep a close eye on the dates.
- Real adoption numbers matter more than anything. Are merchants actually using this? Are enterprises signing up? Without tangible growth here, any price recovery is just speculation.
- Competition is fierce. There are dozens of AI-blockchain projects fighting for attention, and if Bitcoin tanks or the overall narrative shifts, altcoins like SAHARA tend to get hammered.
- Watch what the whales are doing. Big holders either accumulating or dumping can move the price dramatically, often before it shows up in the usual indicators.
Probable Price Range Forecast for Next 4-8 Weeks
Being realistic about it, over the next month or two, we’re probably looking at a trading range between $0.0295 and $0.0355. If it can push above $0.0335 and hold, that would be a legitimate bullish signal. But if it slips below $0.0300, expect it to drift down toward that $0.0280–$0.0290 support cluster where buyers might finally show up in force.