Recent Developments & Market Sentiment
Succinct, trading under the ticker PROVE, has gone through some pretty dramatic changes in recent months. Right now, as of mid-December 2025, the token is sitting around $0.42—that’s a painful 25-30% drop from where it was back in August when it peaked near $1.50-$1.70.
Despite the price pullback, there’s actually been some solid progress on the fundamentals side. The team integrated with Mantle through their OP-Succinct framework, which helped push Mantle’s total value locked past $2 billion. They’ve also rolled out a privacy-focused Proof-of-Reserves protocol with Unitas and expanded listings to Latin American exchanges like Bitso.
All of this sounds bullish on paper, and it does strengthen PROVE’s position in the zero-knowledge proofs infrastructure space. But the market isn’t rewarding it yet. Sentiment indicators are showing fear, with the greed index sitting at just 28, and the 30-day price action has been pretty discouraging for holders.
Technical Indicators & Key Price Levels
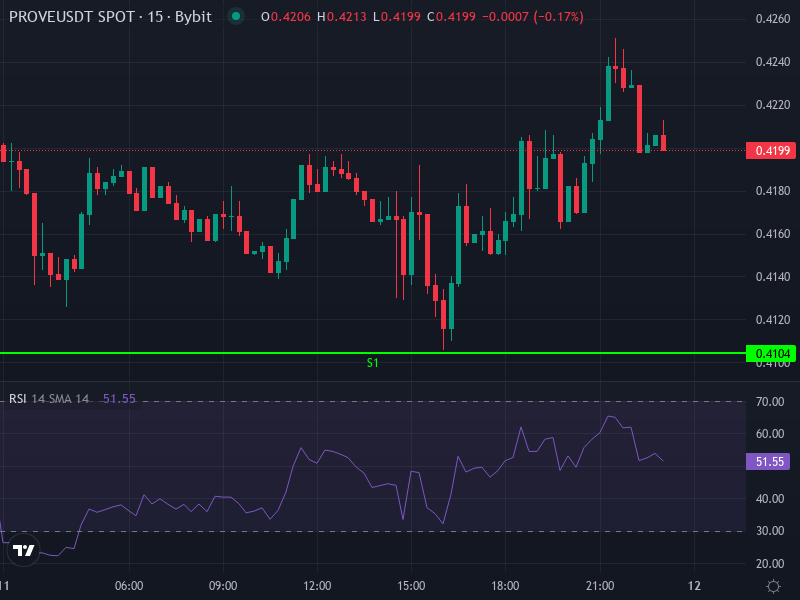
When you look at the technicals, the picture gets clearer—and it’s not exactly pretty. The 4-hour RSI is hanging around 42, which means we’re not oversold yet, but there’s definitely a lack of buying enthusiasm. It’s that uncomfortable middle ground where things could go either way.
The MACD on the 4-hour chart isn’t helping either. The MACD line is below the signal line with a negative histogram, confirming that short-term momentum is pointing down.
Moving averages are acting as overhead resistance right now. Both the simple and exponential moving averages on the 4-hour chart are hovering near $0.432-$0.433, basically capping any attempted rallies.
Looking at the daily pivot points, we’ve got the main pivot sitting around $0.4206. Above that, resistance levels stack up at $0.4306, then $0.4408, and finally $0.4508. On the flip side, support levels are mapped out at roughly $0.4104, $0.4004, and $0.3902.
Pattern Observations & Volume Dynamics
Volume tells an interesting story here. There were some decent spikes earlier on, especially when PROVE tried to push past the $1.00 mark, but those bursts didn’t last. Since then, we’ve seen volume dry up alongside the price decline, which is never a good sign.
The chart patterns that have formed include descending channels and declining resistance trendlines. Previous support zones have basically been abandoned as sellers keep pressing lower.
What this means is that any real upside breakout is going to need a push above that $0.430 resistance with conviction, while protecting the daily supports. If we lose support below $0.40, things could get ugly fast, with a slide toward $0.39 or lower becoming very possible.
Price Forecast Scenarios
Let’s walk through what could happen over the next few weeks based on where things stand now, keeping in mind both the technical setup and the fundamental developments.
Bullish Scenario (Probability: Moderate, ~35–40%)
If PROVE manages to break cleanly above $0.432-$0.435 and actually hold it, we’d be looking at resistance targets around $0.45 first, then $0.50. For this to happen, we’d need to see volume come rushing back in—maybe from a new exchange listing, a major partnership announcement, or just broader enthusiasm for zkVM adoption.
Getting above $0.50 would be a big deal psychologically and could attract momentum traders who’ve been sitting on the sidelines. In a really optimistic scenario, we could even see a push back toward the $1.00 range, especially if the broader Ethereum ecosystem is doing well.
But let’s be real—this depends a lot on factors outside of PROVE’s control, like general market sentiment, regulatory news, and whether the team can actually deliver on their scalability and cross-chain promises.
Bearish Scenario (Probability: Higher, ~60–65%)
Unfortunately, the odds seem tilted toward more downside right now. The selling pressure is real, and if PROVE can’t hold above that $0.4206 pivot, things could unravel quickly. Watch for breaks below $0.410 and $0.400—those are critical levels.
If we slip below $0.39-$0.40, we could see some panic selling that pushes the price down toward $0.35 or even $0.30. That would put PROVE near cycle lows, which would be a tough pill to swallow for anyone who bought near the highs.
More red flags would include continued weak volume, wallet holders losing confidence, and any negative headlines in the broader crypto market. Even if technical indicators drift into oversold territory, we might not see a bounce without some really strong positive news or major buying support.
Strategic Implications for Traders & Investors
If you’re trading short-term, you’ll want to wait for clear breakout confirmation above those 4-hour moving averages and watch for the RSI to climb back above 50 before jumping in long. On the downside, definitely use tight stop-losses just below $0.410 to protect yourself if things break lower.
For those thinking longer-term, there’s still a case to be made for Succinct. Their roadmap includes some promising cross-chain integrations planned for mid-2026, plus a move toward decentralized governance. If you believe in the zero-knowledge proofs narrative, accumulating around established support levels might offer decent risk-reward down the line.
Either way, volume is the key thing to watch. Without solid volume backing any upward moves, those resistance zones are just going to keep rejecting rallies like we’ve already seen happen.