
Recent Performance and Foundational Dynamics
AVNT, the native token of Avantis—a perpetuals decentralized exchange on the Base network—has been through quite a ride lately. Just weeks after launching in September, the token shot up an impressive 576%, hitting an all-time high around $1.41 before pulling back sharply to the $1.20 area. What fueled this rally? Pretty solid numbers at the protocol level. Back in August, Avantis grabbed about 39% of all perpetual trading volume on Base and brought in strong fee revenue, with total value locked peaking somewhere between $22 and $23 million. But after intense profit-taking and more tokens flowing into exchanges, the correction that followed showed that some of that bullish energy was cooling off.
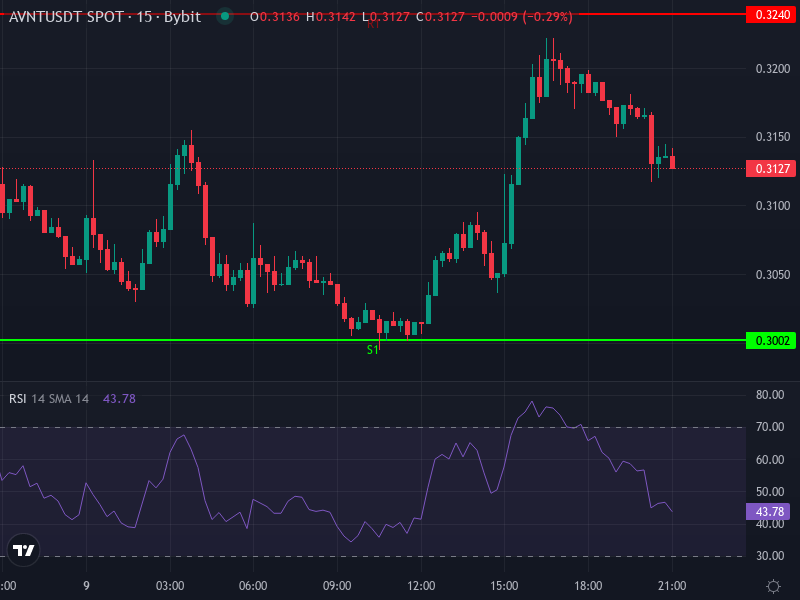
Right now, AVNT is trading around $0.31 USDT—way below those earlier highs—which suggests either the worst of the selling is over or we’re in for an extended sideways grind unless something reignites growth. On the bright side, whale accumulation and fewer tokens sitting on exchanges hint that some smart money is getting comfortable at these lower prices. Still, upcoming token unlocks and swings in market sentiment remain wildcards. All of this sets the backdrop for trying to figure out where price might head next.
Indicator-Based Analysis and Key Price Zones
Looking at the 4-hour chart, here’s what the indicators are telling us about AVNT right now:
- Relative Strength Index (RSI): Around 44.6 — showing mild bearish momentum without being oversold yet, though this is the kind of zone where buyers sometimes start stepping in if there’s a good reason.
- MACD Line: −0.0067 / Signal Line: −0.0087 with a tiny positive histogram of about +0.00195 — this points to a recent bullish crossover, possibly an early hint that the trend could flip upward, though it’s not exactly screaming strength yet.
- SMA (Simple Moving Average) & EMA (Exponential Moving Average): Both sitting around $0.320-$0.321 — these are acting as resistance right above current price.
On the daily timeframe, pivot points paint this picture:
- Resistance levels: R1 around $0.32397, R2 at $0.33543, R3 near $0.34777.
- Support levels: S1 roughly $0.30017, S2 at $0.28783, S3 around $0.27637.
- Central pivot: About $0.31163 — basically right where we’re trading now, showing that bulls and bears are in a tight tug-of-war in this zone.
What this means is that the daily support zone between $0.28 and $0.30 could be a solid floor if sellers keep pushing. Meanwhile, resistance between $0.32 and $0.35 will likely cap any upside unless it gets smashed through with conviction and volume behind it.
Scenarios & Projections Based on Technical Momentum
Based on what the charts are showing and weighing risk versus reward, here are a few likely paths forward:
- Bearish continuation: If AVNT can’t hold around $0.30, we might see it test deeper support near $0.28 or even $0.25. Further drops could line up with upcoming token unlocks or broader market weakness.
- Neutral / consolidation mode: Price bounces between $0.30 and $0.35, building a base around that daily pivot. MACD might go flat, RSI hangs around 40-50, and everyone waits for a fresh catalyst—maybe the RWA product launch or a major exchange listing—to push things one way or another.
- Bullish rebound: A convincing push above $0.32–$0.35 backed by volume, with MACD staying positive and RSI climbing toward 60, could send the token back to $0.45–$0.55 in the near-to-medium term. Getting past $0.60 would need more serious momentum—probably institutional interest or big news.
What Could Trigger the Next Move?
Beyond what’s happening on the charts, a couple of big factors will determine which of these scenarios plays out:
- Fundamental catalysts: Growth in Avantis’ RWA markets, new partnerships, or upgrades that sweeten the deal for liquidity providers could boost demand and confidence. On the flip side, token unlocks or regulatory issues could add selling pressure.
- Volume-based confirmation: Technical breakouts only matter if there’s real volume behind them. A move above resistance on weak volume is likely to fizzle out. Keep an eye on exchange flows—whale accumulation has lined up with upward moves before.
Without a major catalyst or uptick in real usage, AVNT will probably keep treading water in its current range. For traders, buying near support ($0.28–$0.30) and selling into resistance ($0.32–$0.35) offers a decent risk-reward setup. For longer-term holders, tracking institutional accumulation and how much the protocol is actually being used will be crucial in deciding whether to hold tight or lighten up.