Market Overview & Recent Developments
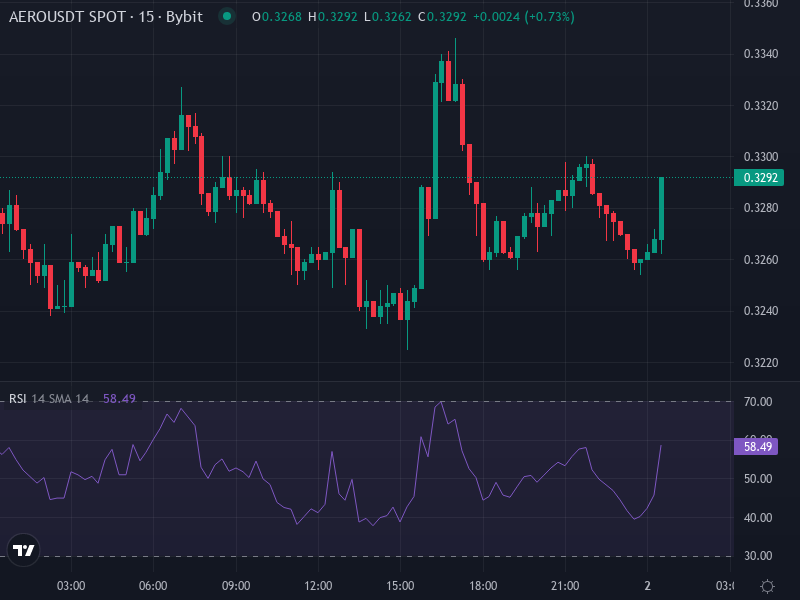
Right now, AERO/USDT is trading at around $0.32668, down roughly −13.52% over the last 24 hours. That’s a pretty sharp drop, and it’s happening alongside a lot of turbulence across the broader crypto market. When you look at the technical indicators, things are leaning bearish—moving averages are painting a mixed picture, but most oscillators are flashing sell signals. For example, daily indicators like the CCI and Williams %R are pointing downward, though the RSI is sitting neutral in the mid-40s. Volatility is running high too, based on ATR readings, which adds extra risk if you’re trading short-term.
On the fundamentals side, AERO used to have some solid tailwinds—things like token buybacks, emission controls, and growing revenue. Plus, initiatives like the Public Goods Fund, Flight School, and Relay helped lock up large amounts of AERO and reduce circulating supply. But lately, those positives haven’t been enough to offset the technical weakness. AERO is getting hit hard just like most other altcoins and DeFi tokens in this current selloff. So between the technical signals and overall market sentiment, there’s clear pressure on the token right now.
Technical Indicators & Key Levels
Trend & Moving Averages: AERO is currently trading below its major moving averages, including both the 50-day and 200-day EMAs and SMAs. That tells us the bigger trend is still pointing down. The shorter-term moving averages—like the 5-, 10-, and 20-period ones—are showing some mildly bullish or neutral crossovers, but those are getting overshadowed by the bearish pressure from the longer timeframes.
Momentum & Oscillators: The RSI is hovering in neutral territory, so we’re not seeing overbought or oversold extremes. The MACD is basically flat or slightly negative, which means momentum is weak. The Stochastic RSI and Williams %R have been hinting at oversold conditions recently, but we haven’t seen a clear reversal take hold yet.
Volatility & ATR: The Average True Range is elevated, representing around 8-10% of the current price. Translation: you’re going to see bigger swings throughout the day. That can be great for scalpers, but it’s risky if you’re holding positions.
Support & Resistance Zones: The nearest support sits around $0.30–$0.31, and we’ve seen the price test that level recently. If that breaks, the next support zone is lower, closer to $0.28. On the upside, immediate resistance is around $0.34–$0.35. If we get some bullish momentum, there’s stronger resistance waiting near $0.37–$0.38.
Pattern Notes: We’re not seeing any strong bullish patterns forming—no double bottoms or inverse head and shoulders here. The price action looks more like a consolidation pattern with a slight downward tilt. Trading volume has been pretty quiet too, which isn’t helping any breakout attempts gain traction.
Scenario Analysis
Bullish Scenario: If AERO manages to break cleanly above that ~$0.35 resistance with solid volume and improved market sentiment, we could see a short-term bounce toward $0.37–$0.40. For that to happen, we’d probably need continued emission controls, fresh buybacks or protocol upgrades, and no nasty macro surprises.
Bearish Scenario: On the flip side, if the $0.30 support level gives way, we might see the price slide down toward $0.25–$0.27. Given how strong the selling pressure has been and the lack of buying interest, this downside scenario is definitely on the table.
Neutral/Sideways Scenario: Without any major catalyst, AERO could just chop around between $0.30 and $0.35 for a while, stuck in a range until either market sentiment shifts or we get some meaningful news.
Price Prediction & Timeframes
Looking at the current technical setup and the broader market environment, here’s what seems realistic for price movement:
- Short-term (1-2 weeks): We’ll probably see another test of that $0.30 support level. Resistance around $0.34 is likely to cap any upside unless we see a pickup in volume.
- Mid-term (1-3 months): If the bearish momentum continues, the price could drift down toward $0.25–$0.27. But if things turn more bullish—maybe through emission reductions or positive protocol news—we could be looking at a range of $0.38–$0.45.
- Long-term (6-12 months): If Aerodrome delivers on some key fundamentals—like new exchange listings, governance improvements, or continued growth in the protocol—AERO might push toward $0.60-$0.80. Without those catalysts, though, it could struggle to stay above $0.40 and might just drift sideways or lower.
Factors That Could Shift the Outlook
There are several things that could really move the needle on AERO’s price direction going forward:
- How well the team executes on tokenomics—more buybacks, locking up emissions, expanding utility for the token.
- Broader market conditions—macroeconomic trends, interest rate changes, and overall risk appetite for DeFi and altcoins.
- Technical breakout signals—we’d need to see high volume pushing price above resistance, or a sharp reversal pattern forming near support.
- Competition and innovation—Aerodrome’s ability to compete within the Base ecosystem and the wider DeFi space, particularly around liquidity, yields, and integrations.
Final Insight: If you’re already holding AERO, it might make sense to protect your capital with tight stop-losses near those support levels. If you’re thinking about getting in, you might want to wait for some confirmation that the trend is actually reversing above resistance. Right now, the risk-reward setup favors being cautious unless we start seeing some strong bullish catalysts show up.