
Recent Developments & Fundamental Strengths
Block Street’s native token, BSB, has been making waves lately with several interesting developments. The team recently dropped their tokenomics details, and they’re pretty strategic: total supply sits at 1 billion tokens, but only about 20.775% entered circulation at launch. That tight initial float explains why we’ve seen some wild price swings early on—there just aren’t that many tokens floating around yet. The allocation breakdown is telling: roughly 36% goes to the team, advisors, and early investors (all locked up tight), while community and ecosystem partners get about 42%, mostly vesting over four to five years.
On the product side, Block Street is pushing two main offerings—Aqua, which handles cross-chain liquidity routing, and Everst, focused on leveraged tokenized equities. Basically, they’re trying to build a bridge between traditional finance and DeFi, especially in the fragmented real-world asset space. The token launched in early March 2026 across exchanges like Bybit and XT.com, with airdrops, ecosystem incentives, and a Binance trading competition (around $100,000 in BSB rewards) generating solid buzz and trading volume.
Technical Indicators & Price Action Insights
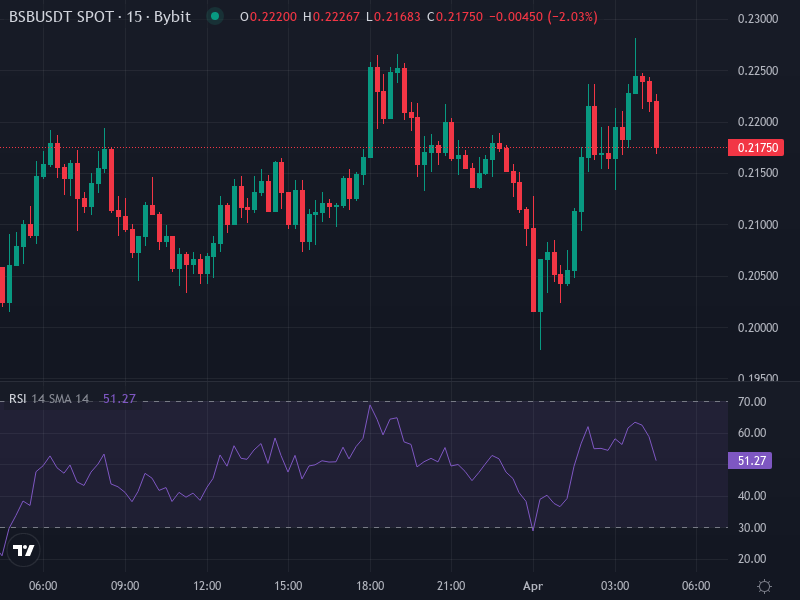
Right now, BSB/USDT is hovering around $0.2187, up roughly 7.46% over the last day. Volume is absolutely cooking—we’re seeing turnover that dwarfs the actual circulating market cap, which suggests a mix of speculative trading, possible institutional plays, or heavy algorithmic activity. When you see that kind of volume-to-cap divergence, it usually means volatility is brewing, either for a breakout or a sharp pullback.
Breaking down the technicals:
• Support & Resistance Levels: Early data shows BSB hit an initial high around $0.14, then pulled back into the $0.11-$0.08 range. Since current price is well above that former high, we’re probably looking at new resistance forming somewhere between $0.25-$0.30 if this momentum holds.
• Moving Averages: Given how fresh this listing is, short-term moving averages (10- to 50-period) are still playing catch-up. Price sitting way above MAs after a surge like this often leads to consolidation or mean reversion.
• Momentum Indicators (RSI, MACD): Early movement suggests RSI likely pushed into overbought territory after the listing pump. MACD probably shows bullish crossovers, but if buying pressure fades, we could see bearish divergence creep in.
• Volume Trends: Consistently high volume means every move matters more. If we see volume spike on a push past resistance, that’s bullish confirmation. But if volume dries up while price climbs? That’s a red flag for reversal.
Price Scenarios & Forecast Based on Technical Cases
Bullish Scenario
If BSB punches through resistance around $0.25 with conviction and volume to back it up, we could realistically see $0.35-$0.40 by year-end. Getting there would require Aqua hitting that ambitious $800 million monthly volume target, plus maybe snagging a major exchange listing—think regular Binance Spot. Those kinds of catalysts would be game-changers.
Moderate / Base Case Scenario
More likely, we see some cooling off as momentum normalizes and broader market conditions weigh in. Expect BSB to bounce around in the $0.15-$0.20 zone for a while, with support forming around $0.12-$0.14 and resistance near $0.22-$0.25. As vesting schedules kick in and community sentiment settles, gradual appreciation toward $0.20-$0.28 by late Q3 or Q4 seems reasonable, assuming the team delivers on roadmap promises.
Bearish Scenario
Downside risks are real. Regulatory scrutiny around tokenized securities, delayed milestones, or backlash from underwhelming airdrop distributions could sink sentiment fast. If confidence cracks, we might see support break around $0.10 or even slide toward $0.07, especially when early holders start unlocking and potentially taking profits.
Indicators to Monitor & Timing of Key Events
To stay ahead of the curve, here are the key things to track:
• Watch for a clean close above $0.25 that holds for multiple days with above-average volume—that’s your breakout confirmation.
• Look for bullish moving average crossovers, particularly the 20-period crossing above the 50-period, signaling fresh upward momentum.
• Monitor MACD histogram expansion and keep RSI under extreme overbought levels (below 80) to avoid getting caught in a reversal.
• Pay attention to vesting unlock schedules—as locked tokens start flowing into circulation, watch for selling pressure showing up in volume and price action.
• Track fundamental milestones: Aqua volume targets, new exchange listings, regulatory developments, and network expansion. Each success reduces risk and justifies higher valuations.
Estimate Timelines
Based on current momentum and realistic execution of fundamentals, hitting $0.20-$0.25 could happen by mid-year. Reaching that $0.35-$0.40 range would need major catalysts landing by Q4 2026. On the flip side, bearish reversals could happen quickly if catalysts flop or unlocks flood the market without corresponding demand—potentially pushing back below $0.10.
Investment Implications & Risk Management
Whether you’re trading short-term or holding long, here’s a practical approach: accumulate during dips into the $0.12-$0.15 consolidation zone; take some profits or add hedges when price approaches resistance; use stop losses below key support (around $0.10) to protect downside; and stay alert to unlock schedules and their supply impact. The fundamentals look interesting, but the technicals remind us this is still early-stage and highly volatile. Low circulating supply and nascent product rollout mean the reward potential is real, but so is the risk.