
Recent Developments & Fundamental Context
RedStone has been making some pretty interesting moves in the DeFi infrastructure space lately. The project recently picked up Security Token Market (STM) and the TokenizeThis conference, which significantly expands their data coverage across tokenized real-world assets. This acquisition brought along historical data covering more than 800 tokenized products—everything from equities and real estate to debt instruments and funds. It’s a strategic play that positions RedStone as a critical infrastructure provider for the growing RWA sector.
They’ve also brought Credora into the fold, adding a DeFi-native risk ratings platform that provides default probability assessments and collateral intelligence to lending protocols like Morpho and Spark. It’s the kind of infrastructure that becomes increasingly important as DeFi matures.
On the integration side, RedStone deployed price feeds on the Stellar network, including major assets and tokenized funds such as Franklin Templeton’s BENJI fund. This expansion comes at an interesting time, especially after a $10 million exploit that targeted oracle manipulations highlighted just how vulnerable the ecosystem can be to these attack vectors.
Technical Indicator Snapshot
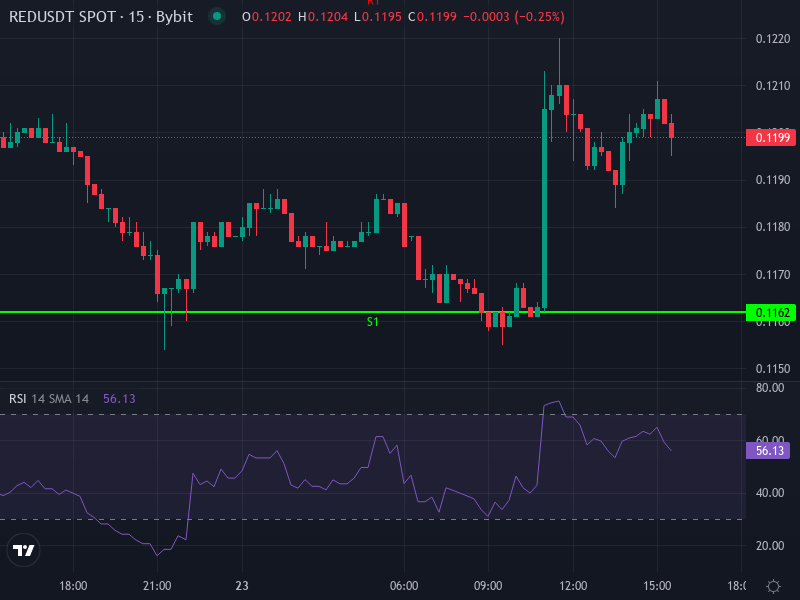
Right now, RED/USDT is trading at around $0.11996. We’ve seen a solid short-term pop of approximately +12.29% over the last 24 hours, which suggests buyers are showing up. However, there’s a complicating factor—early March saw a token unlock event that released over 40 million RED tokens into circulation. That kind of supply increase can put a damper on bullish momentum, at least in the near term.
Looking at the charts on a 4-hour timeframe, here’s what the indicators are telling us:
- The RSI is hovering around 37.37, which shows we’re not quite oversold but definitely on the weaker side. There’s room for a bounce here, but we’re not seeing strong conviction from buyers yet. 4-hour RSI ≈ 37.37
- The MACD remains in bearish territory, with the MACD line sitting at roughly -0.00334 below its signal line at -0.00290. The histogram is negative, confirming that downward pressure is still present. MACD ≈ -0.00334; Signal ≈ -0.00290; Histogram ≈ -0.00044
- Both the Simple Moving Average at 0.12655 and the Exponential Moving Average near 0.12495 are sitting well above the current price. These levels are acting as overhead resistance, and price needs to push through them convincingly to signal any real trend reversal. SMA (4-h) ≈ 0.12655; EMA (4-h) ≈ 0.12495
Zooming out to the daily timeframe, the pivot points give us some useful reference zones:
- Daily pivot point sits at roughly 0.11930—pretty close to where we are now, essentially acting as a center of gravity.
- Resistance levels stack up at R1 around 0.12300, R2 at 0.12610, and R3 up at 0.12980.
- Support levels come in at S1 near 0.11620, S2 at 0.11250, and S3 down at 0.10940.
Price Chart
Price Prediction & Scenarios
Bullish Breakout Scenario
If buyers can push through the immediate overhead resistance around 0.1249 (the EMA) and 0.1266 (the SMA), we could see a move toward the first resistance at 0.12300, followed by a test of R2 around 0.12610. Breaking above R2 would open up space toward R3 at 0.12980. For this to happen, we’d likely need to see strong volume accompanying the move, positive sentiment around how the token unlocks are being absorbed, or news of additional integrations that demonstrate real-world utility.
Bearish & Sideways Likely Path
On the flip side, if the price fails to break through that 0.1249-0.1266 resistance zone, we’re probably looking at a drift lower toward S1 around 0.11620. If that support level doesn’t hold, we could see deeper testing at S2 near 0.11250, with S3 at 0.10940 as the next potential floor. Given that the 4-hour MACD is still bearish and the RSI hasn’t managed to climb back above 50, bears still have the upper hand unless we see some clear reversal signals.
Neutral / Consolidation Phase
The daily Rate of Change is currently sitting at around −6.76%, which suggests we might just be in a consolidation phase. ROCP ≈ −0.06765. A trading range between roughly 0.1160 and 0.1245 seems reasonable while the market digests the recent token unlocks and waits for the next catalyst—whether that’s new blockchain integrations, growth in total value locked, or broader crypto market momentum.
Risks & Key Catalysts to Watch
Risks: The token unlock event is still a cloud hanging over the price action. That influx of supply can suppress any bullish attempts, especially if volume remains weak or if the broader crypto market takes a downturn. Additionally, if on-chain metrics like oracle usage and integration numbers don’t show meaningful growth, it’ll be hard to build positive sentiment.
Catalysts: On the positive side, successful execution of their expansion plans—the Stellar deployment, adoption in institutional RWA pipelines, and usage of Credora’s risk ratings—could provide strong upward momentum. Any regulatory clarity around tokenization or oracle infrastructure would also be a significant boost for RedStone’s narrative.
Outlook Summary
In the near term, RED/USDT is facing headwinds with technical indicators leaning bearish unless something changes the momentum. The resistance zone around 0.125–0.127 is critical—a clean break above could spark a reversal toward 0.130 or higher. If that resistance holds firm, expect the price to retreat toward 0.116, with further downside risk if that level fails. Looking at the medium term, RedStone’s prospects really depend on how effectively they can turn their recent acquisitions and integrations into actual usage and adoption. If the fundamentals deliver, RED could work its way back up. If not, we’re probably looking at more sideways action or gradual decline.