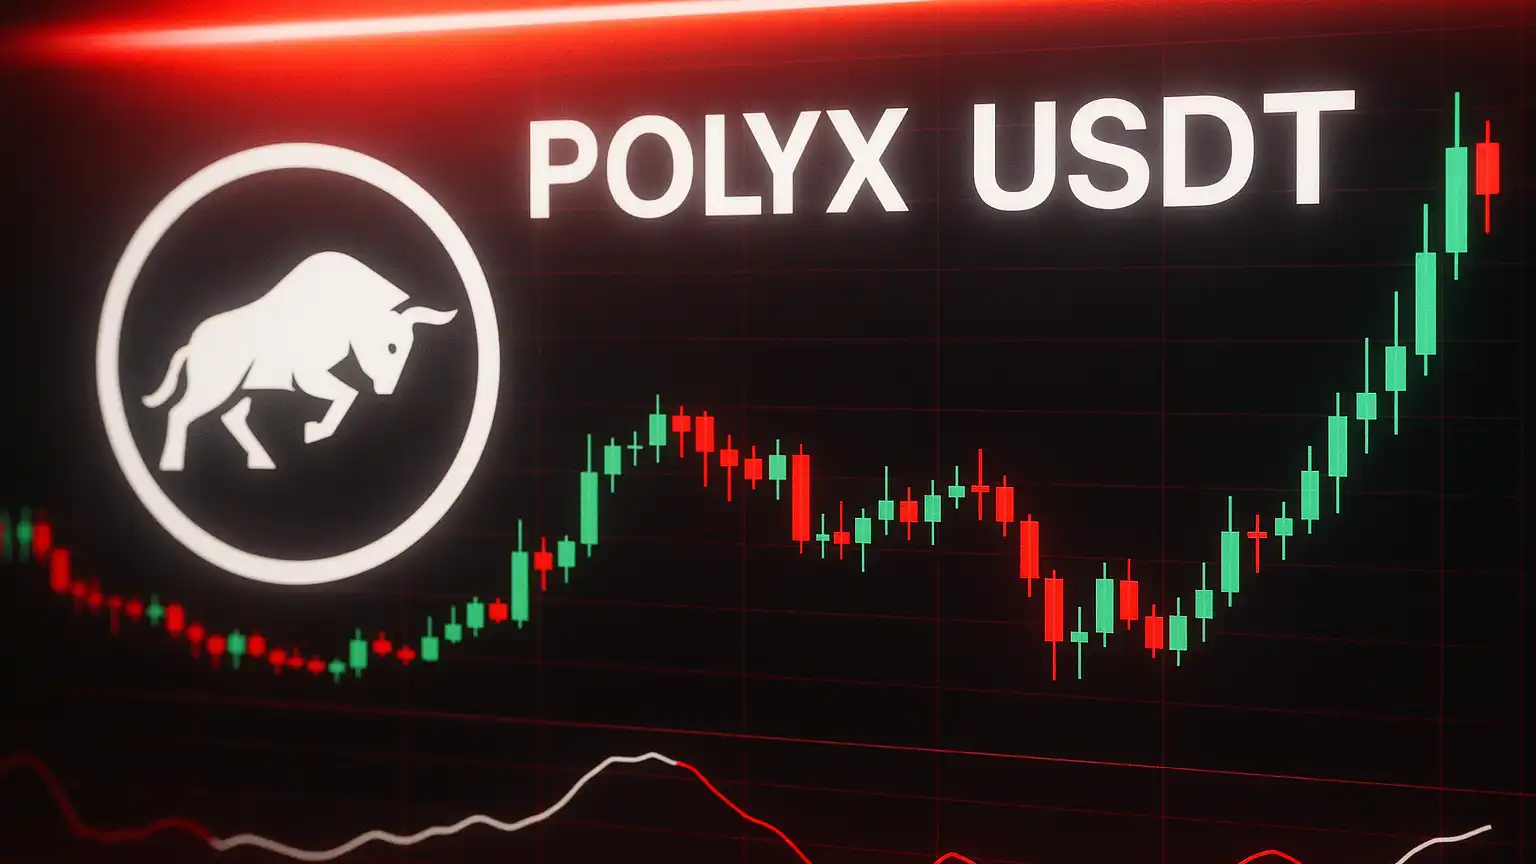
Recent Developments and Market Context
Polymesh (POLYX) has been struggling lately, dropping to somewhere around $0.040–0.0465 USDT, down roughly 0.76% over the past 24 hours. This isn’t exactly new—we’ve been seeing this kind of weakness for a few weeks now, mostly due to disappointing trading volume and not much happening on the protocol side to get investors excited.
Looking at the bigger picture in crypto, POLYX has basically been doing what most risk-sensitive assets do when things get shaky—going down. Between inflation worries, central banks talking tough, and various geopolitical tensions, it’s been rough out there. And honestly, there hasn’t been much going on with Polymesh itself—no big upgrades announced, no exciting new partnerships. So right now, we’re really just looking at the charts to figure out where this might be headed.
The technical picture isn’t great, I’ll be honest. On the daily charts, POLYX is trading well below both its 50-day and 200-day moving averages. The Relative Strength Index is sitting in the low 30s, which means it’s getting close to oversold but hasn’t quite hit panic-selling levels yet. Volatility is still pretty high though, so if we break through some key levels, things could move fast in either direction.
Key Technical Indicators and Support-Resistance Zones
Looking at the 4-hour and daily charts, here’s what stands out:
- RSI (4H): Around 53 right now—pretty neutral. Not showing much bullish energy, but we’re not in oversold territory either.
MACD (4H): The histogram is negative, with the MACD line sitting just below the signal line. That tells us there’s still some bearish pressure hanging around.
SMA (4H): About $0.04686 USDT, which is just above where we’re trading now at roughly $0.04652—so that’s acting as resistance.
EMA (4H): Sitting around $0.04573 USDT—this is our nearby support in the short term. - Daily Pivot Points: The main pivot is around $0.04773 USDT. First resistance (R1) is at about $0.04967, with further resistance levels at $0.05283 and $0.05477. On the support side, we’ve got S1 at roughly $0.04457, S2 around $0.04263, and S3 down at $0.03947 USDT. These give us a pretty good idea of where POLYX might bounce around if it stays in its current range.
Daily ROC (Rate of Change): Showing about 0.148 (or 14.8%)—tells us things have been moving around quite a bit recently, though that momentum seems to be cooling off now.
Short-Term Supply/Demand Battle
Right now there’s a real battle playing out between sellers holding the line around $0.047-$0.049 and buyers trying to protect the $0.044-$0.042 range. The $0.046-$0.047 area (right near that 4-hour SMA) is the first real test. If we can break through that with decent volume, we might have a shot at testing $0.0497. But if we can’t push through, we’re probably looking at a slide back down to $0.0445 or even $0.0426. And if we drop below that $0.0395-$0.040 zone? Well, we could easily revisit those recent lows around $0.0378.
Price Prediction Scenarios (Next 7-14 Days)
Based on what the charts are telling us, here are some scenarios that seem reasonably likely. Keep in mind these aren’t guarantees—just educated guesses based on current technical behavior.
- Neutral to Slightly Bearish Case (most likely): POLYX probably stays stuck between **$0.0445 and $0.0485**. That resistance near **$0.0469** (the 4H SMA) will likely keep a lid on things, while support around **$0.0445** should catch any dips. We’d really need to break above **$0.0497** to get people thinking bullish again.
- Bearish Case (if sellers take over): If we drop below **$0.0445**, especially with heavy selling volume, things could get ugly fast. We’d probably head toward **$0.0426** (that S2 level) and maybe even test **$0.0395-$0400**. In that scenario, expect to see RSI dropping into the mid-20s and MACD looking increasingly negative.
- Bullish Upside (needs something to trigger it): If the overall crypto market catches a bid and POLYX starts seeing better volume, breaking through **$0.0477-$0.0480** could open the door to a run toward **$0.050-$0.053**, maybe even testing resistance near $0.0547. But honestly, this scenario needs either a broader market rally or some positive news from Polymesh itself—and we’re not seeing signs of either yet.
Just a heads up—the risks here are pretty significant. POLYX doesn’t trade with huge volume compared to bigger altcoins, which means price swings can be exaggerated and you might not get filled at the prices you expect. Plus, if we get any nasty surprises from economic data or new regulations, even the optimistic scenarios could fall apart quickly. If you’re trading this, definitely use stop losses.
Final Thoughts
Polymesh is basically at a crossroads right now. The technical indicators suggest we’re probably in for more sideways action or maybe a gentle drift lower unless something changes in the broader market sentiment. Holding above **$0.0445** looks really important to avoid further losses. On the flip side, we’d need to see a solid break above **$0.047-$0.049** with strong volume to get the bulls interested again. Without any real news from the protocol or a shift in the overall crypto market, my best guess is POLYX continues moving sideways or edges slightly lower over the next week or two.