
Recent Ecosystem Developments and Market Context
FLOKI has been steadily transforming from a simple meme coin into something with genuine utility. The team is pushing forward with projects like Valhalla, their play-to-earn game, TokenFi for tokenizing real-world assets, and FlokiFi Locker for secure asset management. These aren’t just buzzwords—they’re positioning FLOKI in spaces like GameFi and DeFi that actually attract investors looking for more than just quick flips.
The project has been pretty active with marketing campaigns and product rollouts lately. That said, the technical picture isn’t quite as rosy as the hype might suggest. Several analysts have pointed out that FLOKI is dealing with selling pressure across different timeframes. The momentum indicators are flashing yellow lights, even though the community stays engaged and keeps the speculative interest alive.
Current Technical Indicators: Price, Momentum, and Key Levels
Right now, FLOKI is trading at **$0.0000281057**, up about **+3.69%** over the last 24 hours. Looking at the 4-hour chart, we’re seeing mixed signals. The **4h RSI** is hovering around **50.3**—right in the middle, meaning there’s no strong buying or selling pressure at the moment. The 4-hour MACD tells a similar story: it’s slightly negative, with the MACD line barely above the signal line and a tiny positive histogram. Basically, there’s a hint of bullish momentum, but nothing you’d bet the house on.
The moving averages are putting up some resistance. The 4-hour SMA sits at approximately **$0.0000283467**, while the 4-hour EMA comes in a bit lower at roughly **$0.0000280127**. Price is trading below the SMA and dancing right around the EMA. If buyers can push through and hold above that SMA, we might see some short-term gains. If not, well, we could be stuck in this range for a while.
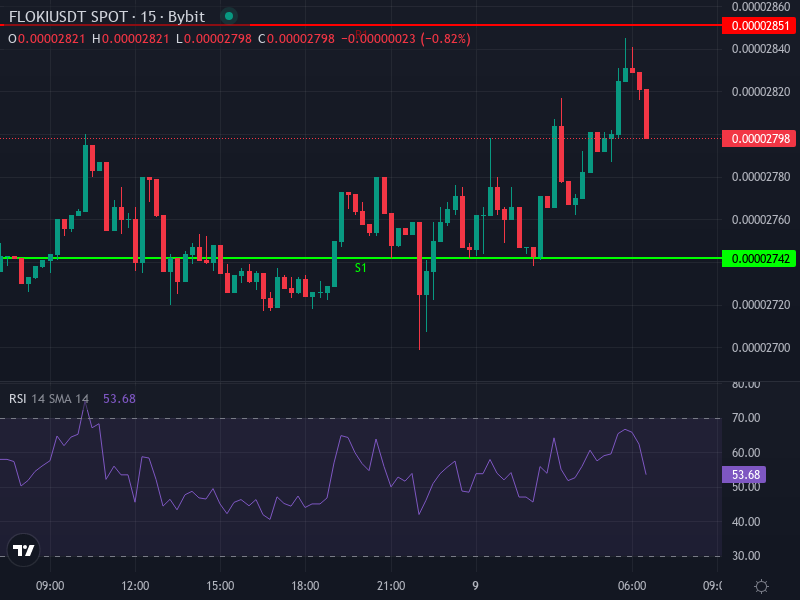
Daily Pivot Points and Support / Resistance Zones
The daily pivot structure gives us a roadmap for where price might head next:
- Pivot (P) ≈ **$0.00002793**
- Resistance 1 (R1) ≈ **$0.00002851**
- Resistance 2 (R2) ≈ **$0.00002902**
- Resistance 3 (R3) ≈ **$0.00002960**
- Support 1 (S1) ≈ **$0.00002742**
- Support 2 (S2) ≈ **$0.00002684**
- Support 3 (S3) ≈ **$0.00002633**
The current price is sitting just above the pivot point and slightly below R1—meaning **$0.00002850** is the immediate hurdle bulls need to clear. If they can’t break through there, we’ll probably see price drift back down to test the pivot or even the support levels below.
Price Prediction Scenarios
Looking at all the data we have, there are really two ways this could play out in the near term: a bullish breakout if things go right, or a bearish consolidation if momentum fades. Let’s break down both possibilities.
Bullish Breakout Scenario
For FLOKI to push higher, we’d need to see a few things come together:
- A clean break above **Resistance 1** at **$0.00002851** with solid volume—not just a quick spike that fades, but a proper 4-hour candle close above that level.
- The MACD needs to turn convincingly positive with the MACD line clearly above the signal line and a growing histogram. Meanwhile, the 4h RSI should start climbing toward the 60+ zone, showing real buying momentum.
- Some positive catalyst from the ecosystem would help—maybe strong user growth in Valhalla, new partnerships, or another exchange listing to bring in fresh liquidity.
If all that lines up, the next stops would be **R2 around $0.00002902** and then **R3 at roughly $0.00002960**. If the broader market cooperates and sentiment stays strong, we could even see a push toward the **$0.0000300–$0.0000320** range.
Bearish / Consolidation Scenario
On the flip side, if resistance holds and buying interest dries up, here’s what to watch for:
- Rejection at R1 (around **$0.00002850–0.00002860**), followed by a slide back down to the pivot near **$0.00002793**.
- If the pivot breaks, that opens the door to **S1 at $0.00002742**, then **S2 at $0.00002684**. A really bad scenario would see price testing **$0.00002630**, though there should be buyers showing up at these support zones.
- Watch the momentum indicators carefully—if RSI on the 4h drops below 45 and the MACD histogram flips negative, that’s your warning sign of increasing downside pressure.
This scenario becomes more likely if the broader crypto market turns sour or if there’s just no real catalyst to drive buying interest. Altcoins tend to suffer when Bitcoin wobbles, and FLOKI won’t be immune to that.
Key Factors That Will Tip the Scales
Two things will probably determine which way this goes. First is **volume and liquidity**—any breakout that happens on weak volume usually doesn’t last. You want to see strong, sustained buying if price is going to push through resistance convincingly. Second are **fundamental catalysts** from the FLOKI ecosystem. Updates showing real usage growth in Valhalla, announcements of new regulated products or exchange listings, fresh partnerships—these are the kinds of events that actually shift sentiment and bring in new money.
Final Insight: Where Might FLOKI Be Headed Next?
Looking at everything right now, the indicators are pretty balanced, which means FLOKI probably isn’t going to make any dramatic moves without a clear trigger. In the short term—say the next week or two—I’d expect consolidation between **$0.00002790** and **$0.00002860**, with a slight lean toward the upside if that resistance breaks. Over the medium term, maybe one to two months out, if the utility projects keep showing progress and the overall altcoin market stays supportive, a move toward **$0.00002950-$0.00003050** looks reasonable. On the other hand, without any real catalysts or if market conditions deteriorate, we could see a drift down toward **$0.0000274** or even lower, though support levels should provide some cushion along the way.