Recent Developments & Market Context
ICON (ICX) has been facing some serious headwinds in early March 2026. Between tighter regulatory oversight, a strong U.S. dollar, and general nervousness across crypto markets, things haven’t been easy. Traders seem to be playing it safe lately, moving away from riskier plays like layer-1 tokens and sticking with more stable options instead.
Looking at the technicals, ICX’s daily RSI is sitting in the mid-20s—that’s pretty deeply oversold territory. The 50-day and 200-day moving averages are sitting way above the current price, which really hammers home the bearish picture on the daily and weekly charts. When you see conditions like this, you’re usually looking at either a major breakdown or a sharp bounce from oversold levels. Most technical signals right now are flashing “Strong Sell,” especially when you look at the moving averages and momentum indicators.
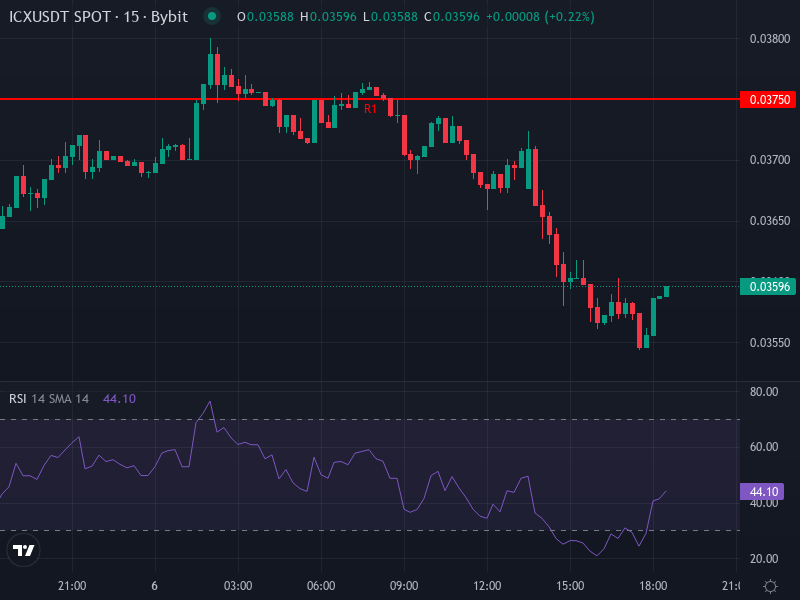
Current Technical Positioning for ICX/USDT
Here’s what the charts are telling us right now:
- The 4-hour RSI is hovering around 43.2—not neutral, but not completely oversold either. This suggests the bears are still in control, though there’s room for a short-term bounce. The MACD on this timeframe has the MACD line sitting below the signal line with a negative histogram, so momentum is definitely weak. Bottom line: the shorter timeframes are looking bearish.
- Both the 4-hour SMA (around 0.0364567 USDT) and EMA (around 0.0366281 USDT) are hanging above the current price of roughly 0.03588 USDT. These are going to act as immediate resistance if price tries to move up.
- Daily pivot analysis shows near-term support around 0.03490 USDT (S1) and 0.03390 USDT (S2). On the resistance side, we’ve got pivots at roughly 0.03750, 0.03910, and 0.04010 USDT. That 0.0375 level is a pretty important psychological barrier where we might see sellers step in.
Price Forecast Scenarios: Probable Paths Ahead
Bullish Counter-Move Scenario
If ICX manages to find its footing here and sellers start to lose steam, we could see a decent relief rally. What we’d need to see first is a bullish MACD crossover on the 4-hour chart and price pushing back above that 0.0366 USDT EMA/SMA cluster. If that happens, ICX could easily test the first resistance pivot around 0.0375 USDT. With enough momentum, we might even see it stretch toward 0.0391 USDT. The key things to watch for would be increasing volume and the 4-hour RSI breaking above 50. Just keep in mind—if it gets rejected at resistance or volume stays weak, any breakout attempt could easily fizzle out.
Bearish Continuation Scenario
To be honest, given how things look right now, continued downside seems more likely. If selling pressure keeps up, ICX could break below that S1 support around 0.03490 USDT. Once that goes, the next stop would be S2 near 0.03390 USDT, and then S3 around 0.03230 USDT. If RSI stays pinned below 30 and the MACD histogram keeps widening to the downside, sellers are going to stay in the driver’s seat. Without some major positive news—either from the broader market or ICON-specific developments—this path seems like the higher probability play. Any bounces we see from here might just be temporary relief rather than actual trend reversals.
Medium-Term Outlook & Key Levels
Looking out over the next 6-12 months, technical models suggest ICX will probably trade somewhere between 0.0316 and 0.0462 USDT, assuming volatility stays elevated and market sentiment doesn’t improve dramatically. A sustained downtrend would push us toward the lower end of that range. On the flip side, if we get positive catalysts—maybe protocol upgrades or friendlier regulatory developments—we could see ICX testing the upper boundaries around 0.044–0.046 USDT.
Strategic Guidance for Traders
Given where things stand, I’d only consider taking a short-term long position if price closes above that EMA/SMA band around 0.0366 USDT with solid volume backing it up. Keep your stops tight, just below recent support at about 0.0349 USDT, to protect your downside. For short positions, things get interesting if ICX drops below S2 around 0.0339 USDT—especially if you get confirmation with a bearish MACD crossover on the 4-hour and RSI heading lower.
If you’re holding for the longer term, keep your eyes on those major moving averages sitting above current price. The 50-day and 200-day averages are acting as overhead resistance, and until ICX can break above those with real conviction, the bearish mood is probably going to stick around.