Recent Developments & Market Context
Sentient has been making waves lately thanks to its ambitious AI-focused roadmap. The project is building community-owned AGI infrastructure, the Dobby model, and the GRID network of agents and artifacts. They’ve also secured an impressive $85 million seed round with backing from heavy hitters like Founders Fund and Pantera Capital. These fundamentals suggest the project has legs for the long haul. Their flagship projects—Sentient Chat, DeepSeek, and fingerprinted AI models—have already pulled in hundreds of thousands of users and community members.
The tokenomics are designed with sustainability in mind. Out of roughly 34.3 billion SENT tokens, 44% go to community incentives and airdrops, 19.55% to ecosystem development and R&D, about 22% to the team, around 12.45% to investors, and 2% for public sale. Importantly, investor tokens are locked up for a full year before they start unlocking gradually over four years. This structure should help keep early selling pressure in check.
New exchange listings have given the token some extra visibility—OKX in Europe and Upbit in South Korea, for instance—which triggered some short-term volume and price spikes. That said, trading volume is still pretty scattered across platforms, and the general vibe suggests people are being reactive rather than showing sustained conviction just yet.
Technical Metrics: Current Levels and Momentum
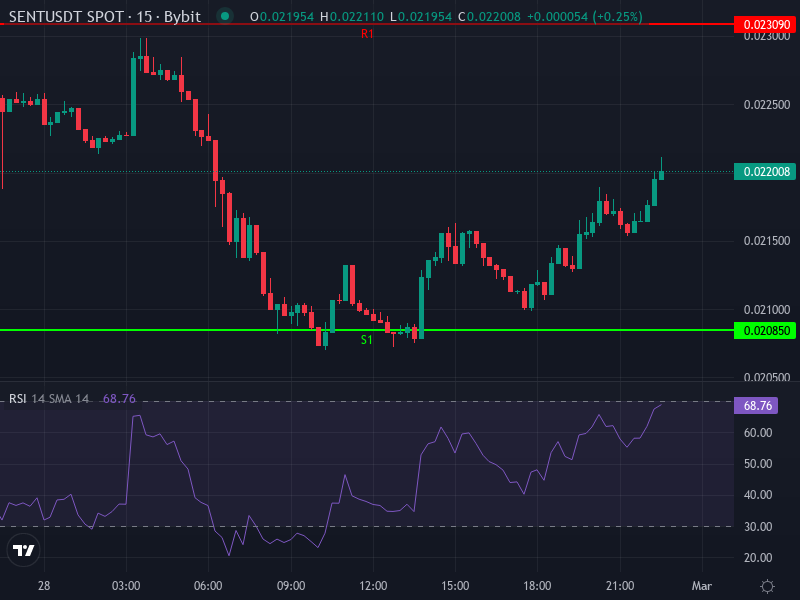
Right now, SENT/USDT is trading at roughly $0.02204, down about 1.33% over the last 24 hours. Looking at the daily pivots, support levels sit around $0.02085 (S1) and $0.01966 (S2), while resistance comes in at $0.02309 (R1), $0.02414 (R2), and $0.02533 (R3). The daily pivot itself is near $0.02190, meaning the current price is hanging just below that midpoint and testing support.
Zooming into the 4-hour chart, the RSI is hovering around 44.6—slightly bearish but nowhere near oversold territory. The 4-hour simple moving average sits at about $0.02303, with the exponential moving average at roughly $0.02269. Since price is trading under both, there’s clearly some downward pressure in recent sessions.
The MACD on the 4-hour isn’t looking great either: the MACD line (around -0.0003906) is below its signal line (about -0.0001729), and the histogram is negative (roughly -0.0002177). However, those negative bars are getting smaller, which might hint that the bearish momentum is losing steam and a base could be forming.
Price Forecast: Scenarios & Targets
Bearish / Range-Bound Scenario
If current support doesn’t hold, the next real floor is around $0.02085 (S1), and after that $0.01966 (S2). A break below these levels with solid volume could push SENT down toward the S2 zone. Given the cautious sentiment and the fact that moving averages are still acting as overhead resistance, there’s definitely downside risk in the near term. If we see a clean break below the pivot with strong selling, we could retest lows closer to $0.01860 (S3).
Bullish / Recovery Scenario
On the flip side, if SENT can reclaim the EMA (around $0.02269) and SMA (about $0.02303) back-to-back, we could see a push toward R1 (roughly $0.02309). Beyond that, resistance zones at about $0.0241 (R2) and $0.0253 (R3) become the next targets. If the team drops major ecosystem news, product launches, or expands liquidity right as the technicals turn, a move toward $0.030 isn’t out of the question over the medium term—assuming bullish momentum kicks in.
Risk Factors and Key Indicators to Monitor
Keep a close eye on trading volume. When volume is thin or scattered, you get a lot of false breakouts. Big liquidity events or concentrated whale activity can swing the price significantly. Also, don’t forget about the token unlock schedule—as team and investor tokens vest over time, that could introduce fresh selling pressure.
The shrinking MACD histogram tells us sellers are still in control but losing some short-term grip. A divergence or crossover here could signal a shift. With RSI below neutral, there’s room for movement in either direction—if it dips into oversold, we might see a bounce or even a short squeeze. Finally, watch how price reacts around those pivot zones, especially the daily pivot at $0.0219, which acts as the balance point right now.