Recent Events & Ecosystem Signals
Flow has been through quite a turbulent period recently. Back in December 2025, the network suffered a major security breach that saw roughly $3.9 million worth of assets stolen. The Flow Foundation’s response was decisive—they burned a staggering 87.4 billion counterfeit FLOW tokens that had been created during the exploit. This was a necessary step to clean up the mess and restore some trust in the network. Still, the damage to confidence hasn’t fully healed, and things got worse when South Korean exchanges started taking action. Upbit, one of the biggest players in the region, slapped a “Trading Caution” label on FLOW and is moving forward with delisting certain trading pairs. Between the security incident and regulatory headwinds, FLOW finds itself in a pretty precarious spot right now.
That said, it’s not all doom and gloom. Flow’s underlying fundamentals actually look pretty solid when you dig into them. The network has attracted over 40 million unique users and processed nearly a billion transactions—those aren’t small numbers. The team has also been busy shipping upgrades, including better developer tools, on-chain automation features, and making progress toward EVM compatibility. These improvements show that Flow is serious about building for the long term and improving the developer and user experience. If market sentiment can stabilize and the regulatory situation doesn’t get worse, these fundamentals might provide a floor for the price.
What Indicators Say: 4-Hour Chart Technicals
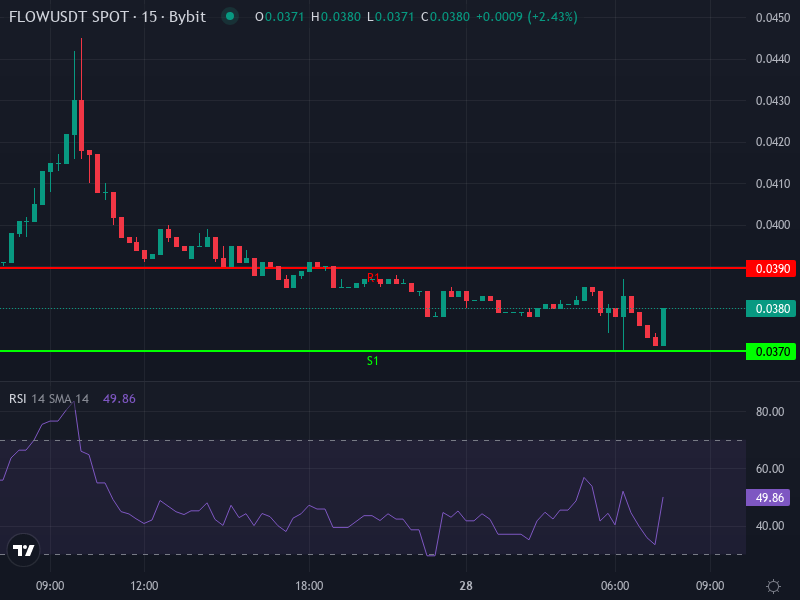
Right now, FLOW is trading around $0.03794, down about 2.89% over the last day. Looking at the 4-hour chart, the picture is mixed but not entirely bearish. The RSI is sitting at 52.93, which is pretty much neutral territory—not overheated, not oversold, just kind of middling. Price is currently trading above both the Simple Moving Average at roughly $0.03674 and the Exponential Moving Average at around $0.03748. That’s at least a minor positive, suggesting there’s some near-term support underneath current prices.
The MACD tells a similar story of cautious optimism. The MACD line is slightly above the signal line—about 0.000510 versus 0.000418—which creates a small positive histogram. This hints at some bullish momentum creeping in, but it’s pretty weak. The histogram bars are thin, meaning any shift in sentiment or lack of buying volume could easily flip things negative. Overall, the 4-hour timeframe leans slightly bullish, but we’re nowhere near a strong breakout setup yet. It’s more of a “wait and see” situation.
Daily Pivot Zones & Predicted Price Paths
When we map out the key price levels using daily pivots, we get a clearer picture of where the action might happen. The daily pivot point sits right around $0.03801, which is basically where FLOW is trading now. Above that, resistance levels come in at approximately $0.03897 (R1), $0.04001 (R2), and $0.04097 (R3). On the downside, support levels line up around $0.03697 (S1), $0.03601 (S2), and $0.03497 (S3). These zones are going to be important to watch for any meaningful moves up or down.
In the near term, if FLOW can stay above that 4-hour EMA around $0.03748 and buyers start to show up, we could see a push toward the first resistance at $0.03897. Breaking through that would be encouraging and could open the door to $0.04001 and possibly even $0.04097 if momentum really builds. On the flip side, if the EMA support fails, we’re probably heading down to test $0.03697 pretty quickly. If that level doesn’t hold, $0.03601 would be the next stop, and things could get uglier from there.
Risk Factors & Timing Considerations
There’s no sugarcoating it—FLOW is still dealing with some serious headwinds. The Upbit delisting and the lingering memory of that security exploit have left investors pretty skittish. People are going to want to see concrete evidence that the network is secure, that exchange access won’t keep deteriorating, and that the regulatory situation—especially in Korea—starts to improve before they commit serious capital. Another thing to watch is volume. That thin MACD histogram we talked about? It won’t mean much if volume doesn’t confirm any breakout attempts. Without volume backing it up, any rally could be a head fake that gets sold into pretty quickly.
Price Prediction Scenarios
Base scenario (most probable): Assuming support around $0.03748 holds and we start to see some decent buying volume come in, FLOW could gradually work its way up toward the $0.0395 to $0.0400 range over the next several days. The first real test will be that R1 resistance near $0.03897. If buyers can push through that level convincingly, we might see a run toward $0.041 or so.
Bearish scenario: If negative news hits—whether that’s more exchange delistings, regulatory crackdowns, or disappointing user growth numbers—FLOW could easily break below both the EMA and SMA support levels. That would likely send price down to around $0.03697 first, then $0.03601 if selling pressure intensifies. Breaking below those levels could trigger a deeper correction toward $0.0350 or even lower, potentially testing that major support zone around $0.03497.
Final Insight
FLOW is sitting at a crossroads right now. On one hand, the token burn cleaned up a major supply problem and the ecosystem metrics show genuine growth and development. The technical setup on shorter timeframes has a slight bullish tilt to it. On the other hand, sentiment is fragile, regulatory risks are real, and the technical signals aren’t strong enough yet to inspire high confidence. If you’re thinking about trading FLOW, watching for a clean break above $0.0395 with solid volume backing it would be the safer entry point. But be ready for the possibility of false moves—this market is still pretty shaky. The smartest play is probably patience, watching how price reacts at these pivot levels, and waiting for clearer confirmation before committing too heavily either way.