Recent News & Ecosystem Developments
Axelar has been through quite a bit lately, and the impact on its short-term price has been mixed—though the long-term vision still looks promising. Back in January 2026, Upbit made some changes to AXL’s supply schedule, releasing roughly 17.1 million tokens (about 1.55% of the total supply) throughout Q1. These tokens are meant for ecosystem growth, validator rewards, and team incentives. While this does create some short-term dilution concerns, it shows Axelar is serious about expanding its network.
Then in late December 2025, something pretty significant happened: Circle acquired Axelar’s original development team (Interop Labs) along with its intellectual property. Here’s the important part though—the AXL token itself and the network weren’t part of the deal. Governance and day-to-day operations got handed over to an organization called Common Prefix. Understandably, this created a lot of uncertainty among token holders, and the price took a hit right after the announcement.
On a more positive note, Axelar keeps building useful features. They recently introduced mXRP, which is a yield-bearing liquid staked token for XRP on their EVM-compatible sidechain. This gives XRP holders more cross-chain yield options. The network now connects over 80 blockchains through its Interchain Token Service, and features like General Message Passing (GMP) and the Interchain Amplifier are still driving integrations with both EVM and non-EVM chains.
Technical Indicators & Price Structure
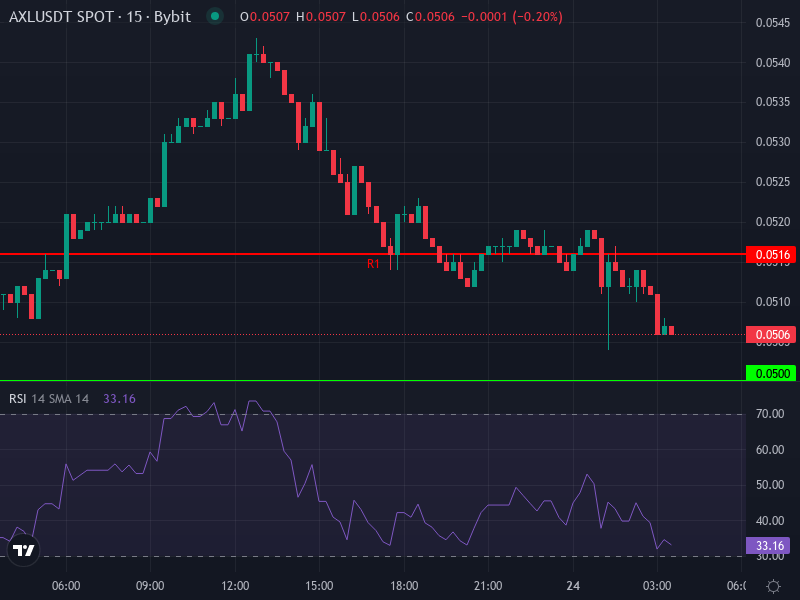
Right now, AXL/USDT is trading around US$0.0509, down roughly 0.31% over the past day as the broader market shows some weakness. Looking at the 4-hour chart, the Relative Strength Index (RSI) sits at about 28.8, which signals that AXL is heavily oversold. The MACD line is hovering just below its signal line (MACD at around -0.001575, Signal at -0.001387), with a slightly negative histogram—this tells us momentum is bearish but the divergence isn’t huge. Meanwhile, both the simple moving average (SMA) and exponential moving average (EMA) on the 4-hour timeframe are sitting around US$0.05463 and US$0.05461, well above the current price. That’s a clear sign of bearish short-term momentum.
Using daily pivot points, we can see resistance levels around US$0.0516 (R1), US$0.0526 (R2), and US$0.0532 (R3). Support zones are mapped at US$0.0500 (S1), US$0.0494 (S2), and US$0.0484 (S3), with the pivot midpoint sitting near US$0.0510. AXL has dropped about 20.4% recently, which really highlights the accelerating downward pressure.
Pattern & Momentum Interpretation
When you put together the oversold RSI, the price sitting below short-term moving averages, and the negative MACD, two short-term scenarios seem most likely. First, we could see a bounce from support (somewhere in the US$0.0484–US$0.0500 range) if buyers step in—especially considering how oversold AXL is on these shorter timeframes. A bounce like that would probably target resistance levels near US$0.0545–US$0.0532. Second scenario: if support around US$0.0484 fails, we could see another drop, potentially down to US$0.0460 or lower.
Price Forecast & Risk Scenarios
Here’s how things might play out based on what we’re seeing technically and what’s been happening with the project:
- Base Case (Consolidation & Relief Bounce): AXL manages to hold the US$0.0484–US$0.0500 support zone, which opens the door for a relief rally toward US$0.0532 (R3) or US$0.0545. This would mean reclaiming those short-term moving averages and showing bullish divergence on the MACD. Trading volume would need to pick up significantly for this to happen.
- Bullish Case (Trend Reversal): If AXL breaks above US$0.0545 with strong volume and holds above those resistance zones, it could push toward US$0.0600. That said, given the recent supply changes and negative sentiment around the team transition, this seems less likely in the near term.
- Bearish Case (Support Break): If support near US$0.0484 doesn’t hold, we’re probably looking at further downside—maybe toward US$0.0450, then US$0.0400. If traders start expecting structural weakness, selling could accelerate, especially if broader market conditions deteriorate or token supply pressures increase.
Key Variables to Watch
A few things will really determine which way this goes:
- Volume at support levels—specifically whether buyers actually defend the US$0.048–0.050 zone.
- Whether the MACD starts turning around or forms bullish divergence as price makes higher lows.
- Overall market sentiment, especially how crypto reacts to macroeconomic news (inflation data, interest rates). As a high-beta altcoin, AXL tends to be pretty sensitive to these factors.
- How well Common Prefix executes on the roadmap, particularly around tokenomics improvements, co-staking features, and general usability enhancements.