Background & News Catalysts
FTX’s bankruptcy proceedings have been making waves lately. Back on February 14, 2026, they locked in a registration date to kick off asset distribution on March 31, targeting accredited creditors and equity holders. In addition to that, FTX submitted an amended notice looking to slash their disputed debt reserves by a hefty US$2.2 billion, though it still needs the court’s green light. These kinds of financial and legal shake-ups usually draw fresh eyes and trading activity to FTT markets.
Technical Landscape & Indicators
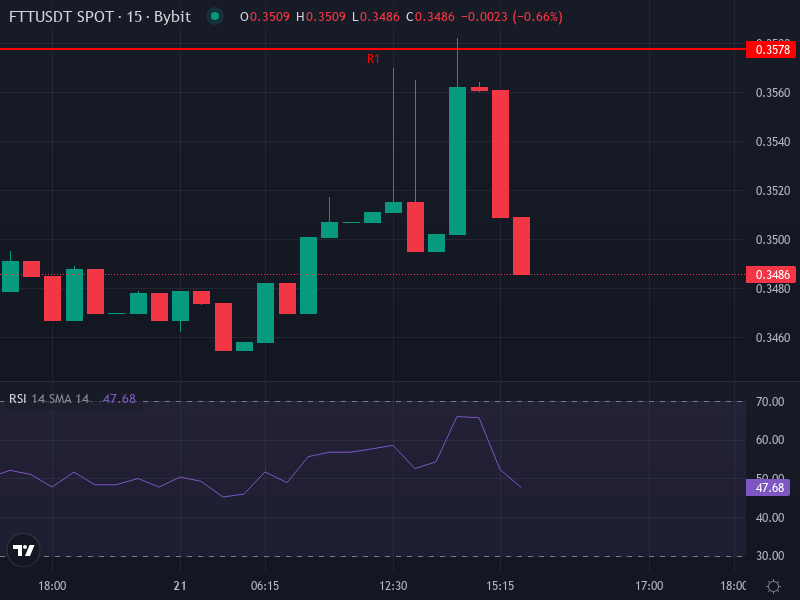
Right now, FTT/USDT is hovering around 0.3498 USDT, up a small ~0.44% over the last 24 hours. That said, when you dig into the technical indicators, things look more bearish or at least pretty neutral when it comes to momentum and trend strength:
- RSI (4-hour): Sitting at roughly 45.95 — it’s kind of stuck in the middle, not oversold and not overbought either. This tells us momentum isn’t really pushing hard in any direction right now.
- MACD (4-hour): The value’s dipped just a bit below its signal line with a slightly negative histogram, which points to some mild bearish pressure on momentum.
- Moving Averages (4-hour): Price is trading under both the 4-hour SMA (around 0.3614) and EMA (about 0.3546), which backs up the idea that we’re in a short-term downtrend.
Support & Resistance Levels (Daily Pivot Points)
Here are the important levels to watch based on daily pivots for FTT/USDT:
- Resistance Levels (Daily): R1 sits around 0.3578, R2 at 0.3647, R3 at 0.3718 — if price bounces upward, these are the spots where it might hit a ceiling.
- Pivot (Daily Baseline): About 0.3507 — the current price is hanging just below this level, which traders often see as a tipping point between more weakness or a potential bounce back.
- Support Levels: S1 around 0.3438, S2 at 0.3367, S3 at 0.3298 — these become important zones if selling pressure really picks up steam.
Price Projections: Scenarios Over the Next 7-14 Days
Looking at where things stand technically, here’s what could realistically play out for FTT/USDT:
- Bearish continuation: If the price can’t get back above that pivot level (around 0.3507) and drops below roughly 0.3450, there’s a good chance we’ll see it test S1 (about 0.3438). Keep sliding from there and we could be looking at S2 (around 0.3367) or even S3 (near 0.3298) if the broader market stays cautious.
- Neutral range bounce: There’s a decent shot we just see consolidation between roughly 0.3438 and 0.3614 if momentum stays flat. In this scenario, any push above daily resistance (around 0.3578) would probably get pushed back down, keeping things choppy and range-bound.
- Bullish reversal: For a real rally to take off, price needs to punch through that 4-hour SMA/EMA zone (somewhere between 0.3614 and 0.3546) with solid volume backing it, a clear bullish MACD crossover, and RSI climbing past 60. If that happens, first stop would be R1 (about 0.3578), then R2 (around 0.3647), with R3 (near 0.3718) as an optimistic stretch target.
What to Watch For
If you’re trading or investing in FTT, here’s what deserves your attention:
- Volume spikes when price moves above resistance or drops below support — that’s where you see real conviction and potential for genuine breakouts or breakdowns.
- MACD histogram changes — if that negative histogram starts shrinking, it could mean bearish momentum is fading out. If it gets wider, that’s more downside risk showing up.
- How price reacts around those daily pivot levels — buyers and sellers often make their stand at these zones, so they’re solid short-term reference points.
- Any news from FTX estate distributions and legal decisions — shifts in these areas can dramatically swing sentiment around FTT.
Estimated Price Targets
When you put all the pieces together:
- Bearish target: Around 0.3300–0.3360 (if we end up testing those S2–S3 support zones)
- Base case (range-bound): Roughly 0.3430–0.3620
- Upside breakout target: About 0.3700–0.3750 (if resistance levels get cleared with conviction)
Final Insight
At the moment, FTT is trading under some pressure, and the technicals lean mildly bearish or neutral at best. Unless something significant comes out of FTX’s legal proceedings or distribution milestones, we’re probably looking at a drift down toward those support zones rather than a strong rally. That said, the resistance levels around 0.3578-0.3647 are going to be crucial turning points. If we see a solid break and hold above those SMA/EMA levels, the outlook could shift toward recovery. But if that doesn’t happen, we might see faster drops toward the lower support bands.