
Introduction: Regulatory Milestones and Market Sentiment
The past few months have been quite eventful for DoubleZero’s native token, 2Z, and not just because of price action. Back on September 29, 2025, something pretty significant happened: the U.S. Securities and Exchange Commission’s Division of Corporation Finance actually issued a No-Action Letter for 2Z. Basically, they said that under certain programmatic token distributions, 2Z doesn’t count as an equity security. This is huge for DePIN (Decentralized Physical Infrastructure Network) projects, which usually exist in a regulatory gray area. It gives utility tokens much-needed breathing room to operate without constantly worrying about enforcement down the line.
On top of that regulatory win, DoubleZero launched its Mainnet-Beta after raising a solid $28 million from heavy hitters like Multicoin Capital and Dragonfly Capital. Their approach focuses on validators, keeps the circulating supply tight (only about 8% at Beta launch), and aims to grow adoption through bandwidth sharing, fiber optic routes, and decentralized routing. Sounds promising, right? Well, things got messy. Shortly after hitting exchanges, controversies erupted over circulating supply numbers that some claimed were nearly five times higher than what official documents stated. That triggered a brutal price drop of around 65%. So despite strong fundamentals, the project’s now battling a serious trust issue that’s weighing heavily on the price.
Technical Indicators: Support, Resistance, and Trend Signals
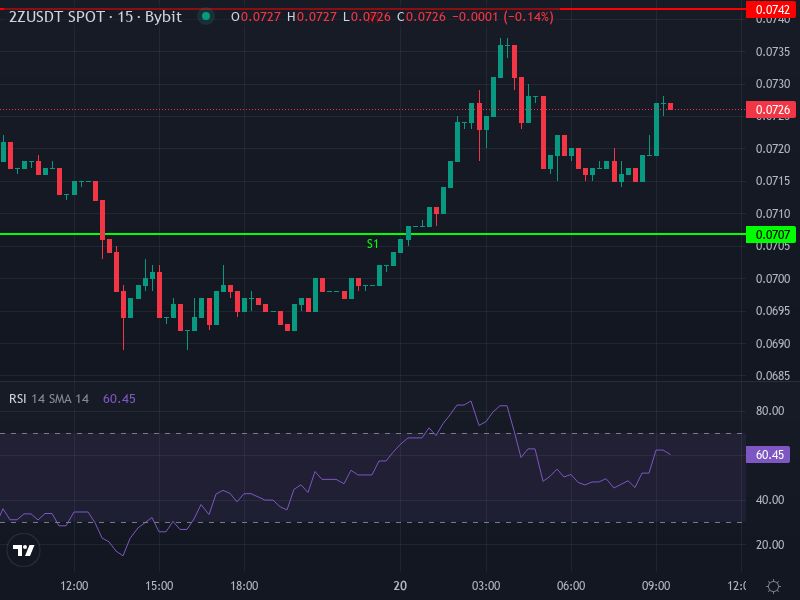
Right now, 2Z is trading at roughly USDT 0.07254, up a modest 0.76% over the last 24 hours. That might sound okay, but when you dig into the technicals, the short-to-mid-term outlook leans bearish. Here’s what the charts are telling us:
- Looking at the 4-hour chart, the Relative Strength Index (RSI) is hovering around 42.7. That shows some bearish pressure, though it’s not quite oversold territory yet.
- The 4-hour MACD histogram is in the red, and the MACD line is sitting just below its signal line (MACD roughly -0.0018635 versus signal around -0.0017634). Translation: bearish momentum is still in play.
- Both the simple and exponential moving averages on the 4-hour timeframe (SMA around 0.0753863 and EMA near 0.0751009) are above the current price, which means they’re acting as resistance right now.
- Daily pivot-point analysis shows resistance levels clustered between approximately USDT 0.07415 and 0.07762 (that’s your R1/R2/R3 zones). Support levels are sitting near USDT 0.07068, 0.06878, and 0.06721 (S1/S2/S3 respectively), with the central pivot point around 0.07225.
Putting it all together, 2Z is clearly trading under some resistance pressure. The USDT 0.075–0.077 range is acting like a ceiling, and meaningful support appears to be anchored around USDT 0.070–0.068, backed by both psychological levels and pivot indicators.
Price Prediction Scenarios: What Moves 2Z Over Next Weeks–Months
Bearish Continuation
If 2Z can’t push back above those moving averages (the 4-hour SMA/EMA sitting near USDT 0.0751–0.0754), we could see downward momentum pick up steam. A break below S1 (around USDT 0.07068) would likely open the door to further losses toward S2 (roughly USDT 0.0688) or even S3 (about USDT 0.0672). This bearish scenario would get worse if negative sentiment from those tokenomics controversies lingers, or if we see big token unlocks hitting the market from upcoming vesting schedules.
Bullish Reversal Potential
For bulls to take control, we’d need to see a convincing break above the SMA and EMA levels (around USDT 0.0751–0.0754), followed by sustained buying that pushes through resistance R1 (roughly USDT 0.07415) and R2 (about USDT 0.07572). If buyers can crack R3 (near USDT 0.07762), that would signal a real shift in momentum and could set up a rally toward USDT 0.080 or beyond. What would trigger that kind of move? Probably clarity on the actual circulating supply, proof that network traffic is growing, expanding validator participation, and maybe some help from a broader crypto market rally.
Final Insight: Risk-Reward Balance & Strategic Outlook
DoubleZero’s 2Z is sitting at a crossroads right now. On one hand, you’ve got solid infrastructure credentials, Mainnet-Beta progress, and that regulatory green light building a compelling long-term case. On the other hand, market trust has taken a serious hit because of murky supply metrics and that sharp early drop. From a purely technical standpoint, the risk-reward setup only really favors long positions if support holds above USDT 0.070. If we drop below USDT 0.067, that pretty much kills the bullish case. For momentum traders, a clean break above USDT 0.0754 on decent volume might offer a good entry. As for fundamental investors, keep your eyes on actual network usage data, token vesting schedules, and any regulatory updates. The bottom line is making sure the project’s promise actually matches what’s happening in the market.