Recent Developments & Fundamental Catalysts
THORChain just wrapped up its v3.15.0 upgrade, which brought in “memoless outbound” transaction support. This might sound technical, but it’s actually a big deal—it removes some of the friction users were experiencing with cross-chain transfers and plays nicer with assets that have strict memo requirements. Basically, moving assets off-chain just got smoother and more reliable for everyday users.
Beyond that, THORChain has been busy expanding—faster integrations with chains like Solana, native swaps that don’t require wrapped tokens, and pushing forward with decentralized app development through Rujira. All of this is strengthening THORChain’s position as serious cross-chain DeFi infrastructure. The development side looks active and engaged, which is always a good sign.
Current Technical Picture (Based on RUNE/USDT Data)
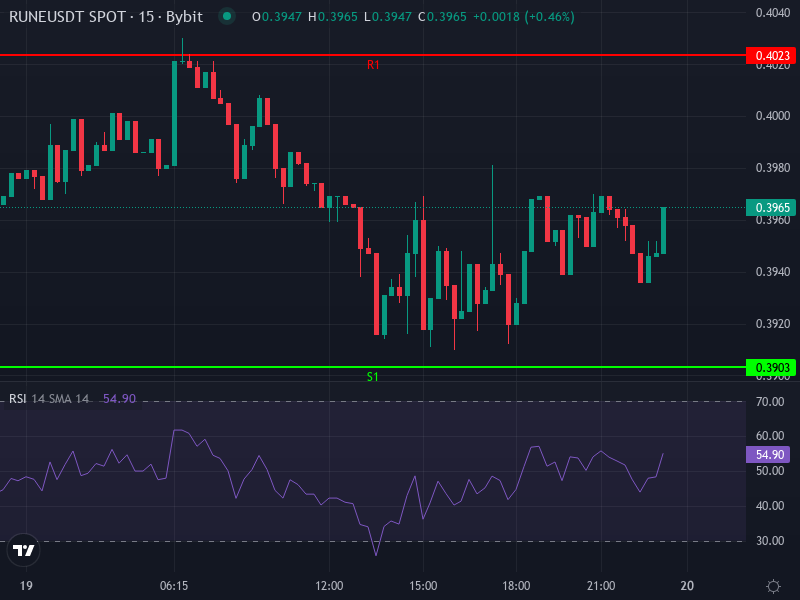
Looking at the latest 4-hour chart, RUNE/USDT is sitting around $0.3964. The 4H RSI is hovering at about 43.3—slightly bearish, but we’re not in oversold territory yet. The MACD line is just below its signal line (MACD around −0.00285 versus signal at −0.00220), with a thin negative histogram at roughly −0.00065. Translation? There’s some weak downward momentum, but nothing dramatic.
Right now, price is trading below both the 4-hour simple moving average (around $0.4039) and the exponential moving average (about $0.4022). These moving averages are basically acting as a ceiling, so any attempts to push higher are likely to meet some resistance. For daily trading, the pivot points show R1 at $0.4023, the main pivot at $0.3967, and S1 at $0.3903. Lower supports sit at $0.3847 and $0.3783.
Momentum, Resistance & Support Structure
The toughest resistance zone is sitting around $0.402–$0.404, where both moving averages and the daily pivot R1 are converging. If RUNE can’t punch through that area, it’s probably going to drift back down toward the first real support around $0.390. Break below that, and we’re looking at $0.3847, then potentially $0.3783.
On the flip side, if buyers can push through those moving averages with decent volume, we might see a bounce toward $0.420. But honestly, with the current momentum, that seems like a stretch unless something changes—either in the broader market or with the protocol itself.
Price Forecast & Scenarios
Based on what we’re seeing technically and the recent protocol updates, there are two main ways this could play out:
Bearish/base-case scenario: If RUNE keeps getting rejected at that $0.402–$0.404 resistance zone, expect it to test support around $0.390, and possibly drop further to $0.3847–$0.3783. The downward pressure could stick around until something shifts sentiment in a meaningful way.
Bullish alternative: If we get some positive news—maybe a successful new chain integration, a spike in swap volumes, or just general strength in the crypto market—RUNE could break above resistance and head toward $0.420. For a real trend reversal, though, we’d need a clean breakout above those moving averages with solid volume behind it. That could open the door to $0.440 in the short term.
Risk Factors & Observations
The upside is looking pretty constrained right now. The MACD’s negative lean and the RSI’s neutral-to-bearish position aren’t exactly inspiring confidence. Low volume or a lack of fresh protocol news could mean we just drift sideways or slowly slide lower.
On the fundamental side, there are still some lingering concerns about protocol debt from lending and savings features (ThorFi), though a lot of that has been addressed through debt restructuring and TCY tokenization. It’s not a crisis, but it’s worth keeping an eye on.
Timeframe Considerations
Intra-day to 4-hour trades: expect volatility within that resistance-support band we talked about. Best opportunities for quick trades will probably come from rejections or small breakouts at those key levels.
1-week horizon: unless we see a surge in positive momentum, we’re likely looking at a range between $0.378–$0.420, with a slight bias toward support if resistance holds firm.
Monthly outlook: this really depends on major integrations and overall crypto market sentiment. Strong positive catalysts could push RUNE above $0.50, but without those, there’s definitely downside risk back into the mid-$0.30s.
Final Insight
RUNE’s current price around $0.396 tells the story of a protocol in transition—there’s strong technical resistance overhead, fundamentals are mixed, and there’s potential for both downside risk and upside surprises. Unless it can decisively break through that $0.402–$0.404 moving average cluster, we’ll probably see a test of supports in the $0.38–$0.39 range. But if those recent protocol upgrades and cross-chain activity start translating into renewed trader interest and volume, a move toward $0.42 becomes a real possibility as an early acceleration point.