
Recent News & Market Context
MVL—short for Mass Vehicle Ledger—has been making some interesting moves lately that might shake up how people feel about the token’s price. Back on December 12, 2025, they signed something called the “Green Mobility Pact” with Woori Bank Cambodia. Basically, they’re tokenizing eco-friendly transportation rewards in Southeast Asia. What’s cool about this is it gives MVL a real purpose beyond just being another crypto for ride-sharing apps—it could actually drive demand based on actual utility instead of pure speculation. But it hasn’t been all smooth sailing. The token got delisted from BloFin back in August 2025 when they dropped the MVL/USDT trading pair because of liquidity problems. That’s definitely not great news since it makes the token harder to trade and raises some red flags about short-term liquidity.
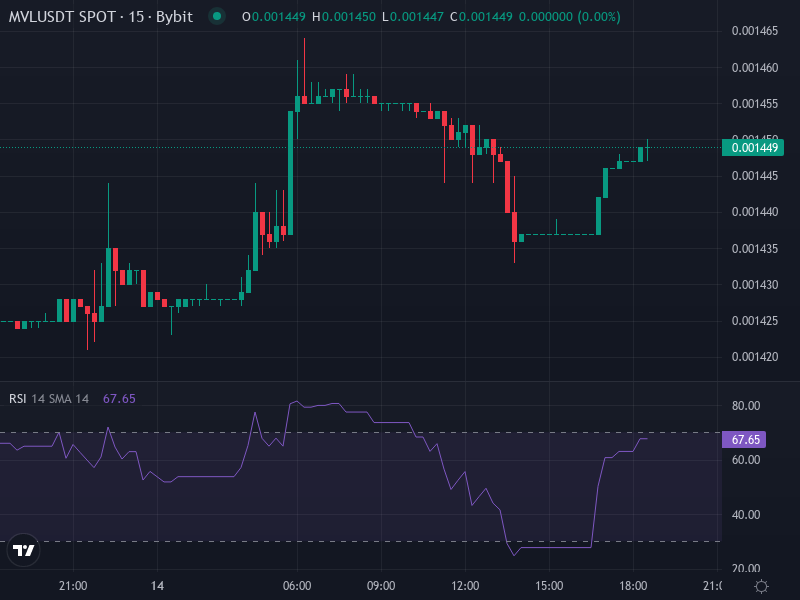
Looking at the charts, things have been pretty rough. Technical analysis from sites like Investing.com and Bitget is showing mostly bearish signals, especially when you look at moving averages across different time periods. The RSI on daily charts is sitting in weak or neutral territory, which tells us there’s no strong buying pressure right now. Support levels look pretty thin, and every time the price tries to push higher, it hits resistance. People are keeping an eye on whether MVL can get some traction through actual ecosystem usage or maybe some positive news, particularly around their TADA ride-hailing service and other mobility projects they’re working on.
Technical Price Analysis Based on Current Data
Right now, MVL is trading at around $0.0014728 USDT. Let’s break down what the technical signals are telling us:
Moving Averages & Trend Structure
Pretty much all the moving averages—whether you’re looking at the 5-day, 10-day, 20-day, or longer—are sitting above the current price and flashing “Sell” signals across the board. The longer-term averages like the 50, 100, and 200-day are even further above, which really drives home that we’re in a downtrend. What this means is that any rally is going to run into resistance at those moving average levels. The price would need to break above the 20-day MA (somewhere around $0.00155-$0.00160) before we could start thinking more bullishly about it.
Oscillators & Momentum Indicators
The 14-day RSI is hanging out in the 30-40 range—below the neutral line but not completely oversold. That leaves a bit of room for a bounce, but it doesn’t guarantee anything. The MACD is slightly negative or close to neutral, showing that momentum has basically dried up. The ADX suggests the downtrend still has moderate strength. Other indicators like Williams %R and CCI are showing similar things—some oversold readings here and there, but nothing that screams a bullish reversal is coming.
Support & Resistance Levels
The most important resistance zone to watch is between $0.00140-$0.00145. There’s a bunch of moving averages and resistance levels bunched up there, so breaking through would be a big deal for any recovery attempt. On the support side, things are tighter: the first support level sits around $0.00137-$0.00138, with weaker support down at $0.001315. If those supports give way, we could easily see the price dropping toward $0.00120 or even lower.
Price Predictions: Scenarios & Possible Trajectories
Taking everything into account—the technicals and the recent news—here’s how things might play out for MVL, along with the risks to watch.
Bearish Base Case
If MVL can’t push back above that $0.00145 resistance, we’re probably looking at sideways trading or a slow grind downward. The support around $0.00137 might hold things up for a bit, but if that breaks, we’re likely headed toward the $0.00130-$0.00125 range. Low trading volume would make the downtrend even worse, especially since exchange support is already shaky. This could all happen over the next few weeks if things don’t improve.
Neutral to Modestly Bullish Case
Now, if the Cambodia mobility deal starts showing real results, or if TADA gets more users, or maybe a new exchange decides to list MVL, we could see a rally back to $0.00145-$0.00150. If the price manages to break through the resistance at the 20 and 50-day moving averages, we might even see it climb to $0.00160. Momentum indicators would need to pick up though—we’d want to see the RSI get above 50 and maybe a golden cross where short-term averages cross above long-term ones. This seems like a mid-term possibility, maybe over the next month or two, but it’s really dependent on getting some positive catalysts.
Bullish Breakout Case
For a real breakout, everything would need to line up just right: big trading volume, success stories from real-world adoption, better exchange access, and maybe a general bull market for altcoins. If all that happens, MVL could potentially challenge resistance above $0.00180-$0.00200 within two to three months. But this isn’t just about a quick bounce—we’d need to see confirmation that the trend has actually reversed. If the breakout attempt fails, the pullback could be pretty steep.
Visualizing the Chart
Final Insight
MVL is sitting at a crossroads right now. What happens next really depends on whether they can deliver on the fundamentals—growing usage, getting the ecosystem buzzing, and improving access on exchanges. The technical picture is mostly bearish or neutral at best, which means any upside needs to be backed by genuine progress, not just hope. If you’re thinking about investing, keep your eyes on that $0.00145-$0.00160 resistance zone—breaking above it could change the whole sentiment. On the flip side, if the support around $0.00137 doesn’t hold, we could be looking at more downside. There’s definitely potential for a bullish turnaround, but honestly, it’s the less likely scenario unless some real catalysts come together.