
Recent Network Updates & Market Context
Back in October 2025, the Kusama network wrapped up its migration to the Asset Hub. This was a pretty big deal for users—transaction fees dropped by about 5 times, and the minimum balance requirements got slashed significantly. If you’re a developer or validator, you’re probably enjoying the lighter on-chain operations and more flexibility when it comes to handling native assets and fee payments.
More recently, in early February 2026, Kusama pushed through its Runtime Upgrade to version 2.0.6. This update locked in several governance proposals, including the approval of Shield v2 and a top-up for the Kusama Bounty program. Sure, these changes are mostly structural and governance-related, but they do show that development work is still chugging along—even though the price has been taking a beating.
Technical Indicator Analysis
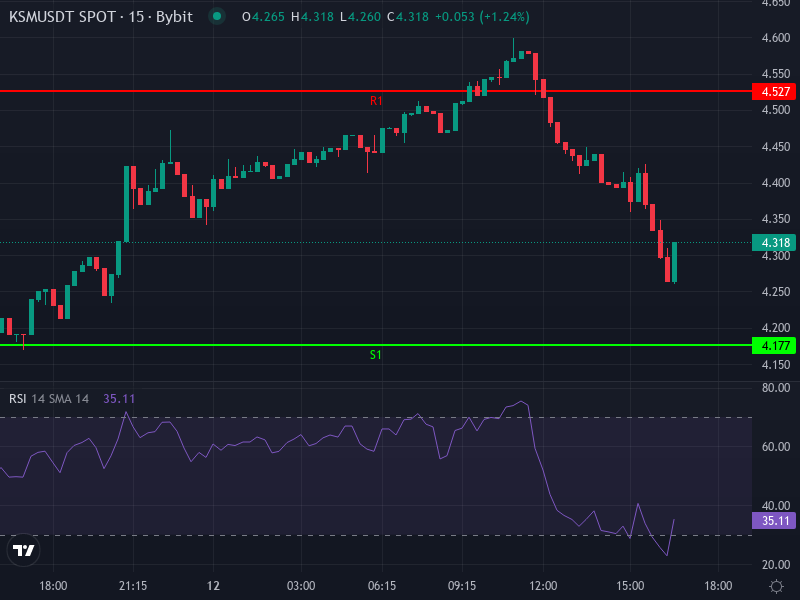
Right now, KSM/USDT is trading around $4.29, up about **+2.48%** over the last 24 hours. Looking at the 4-hour chart, here’s what the short-term indicators are telling us:
- The RSI sits at roughly 45.36—pretty neutral territory, though with a slight bearish tilt.
- MACD shows the line at –0.0281 and the signal at –0.05596, with a positive histogram around +0.02785. There’s a hint of bullish divergence here, but honestly, the overall trend is still pretty weak.
- Both the Simple Moving Average (SMA) at about 4.366 and the Exponential Moving Average (EMA) at around 4.412 are sitting above the current price—meaning there’s resistance overhead.
- Daily pivot levels are looking like this:
Pivot point around $4.39
First support (S1) near $4.18
First resistance (R1) around $4.53
Higher resistance levels are out there, but we’d need some serious momentum to reach them.
Sentiment & Overbought/Oversold Zones
Zooming out to the daily timeframe, KSM is seriously oversold. The RSI has tanked into the low-20s—around 22.2—which tells us that selling pressure has been brutal and might be running out of steam. That said, the MACD is still negative without any convincing crossover yet, and the Average Directional Index shows the downtrend still has some legs, though it might be losing steam.
Short-Term & Mid-Term Price Forecasts
Looking at everything we’ve got—the oversold daily readings combined with weak momentum on the higher timeframes—it seems likely we’ll see either sideways action or a slow grind lower unless something big happens to shake things up.
Here’s what could play out:
- Support zone: The main support we’re watching is near that daily S1 pivot around $4.17, with a deeper test potentially hitting $4.00 if sellers keep pushing. If we break below $4.00, things could get dicey, with $3.80 or lower coming into play.
- Resistance zone: First resistance is hanging around $4.53, and if price can climb back to test the 50-period moving averages on the 4-hour chart (roughly $4.40–$4.45), that would be encouraging. A stronger push could take us toward $4.60–$4.70.
- Probability scenarios:
– Most likely (around 60%): We chop around between $4.00 and $4.50, maybe bouncing toward $4.50 here and there but struggling to hold higher ground.
– Bullish case (about 20%): If we get some positive development news or the broader market turns around, we could break above $4.60 and aim for $4.80 or more—though multi-week moving averages will likely put up a fight.
– Bearish case (about 20%): If macro sentiment tanks or leverage gets squeezed on exchanges, a drop below $4.00 could bring $3.50–$3.80 into focus pretty quickly.
These ranges assume we keep seeing moderate volatility without any major surprises. The key things to watch? Whether RSI can climb back above 50 on the 4-hour chart, confirmation of a MACD crossover, and how price behaves around those 50-hour and 200-hour moving averages.