
Market Context & Recent Developments
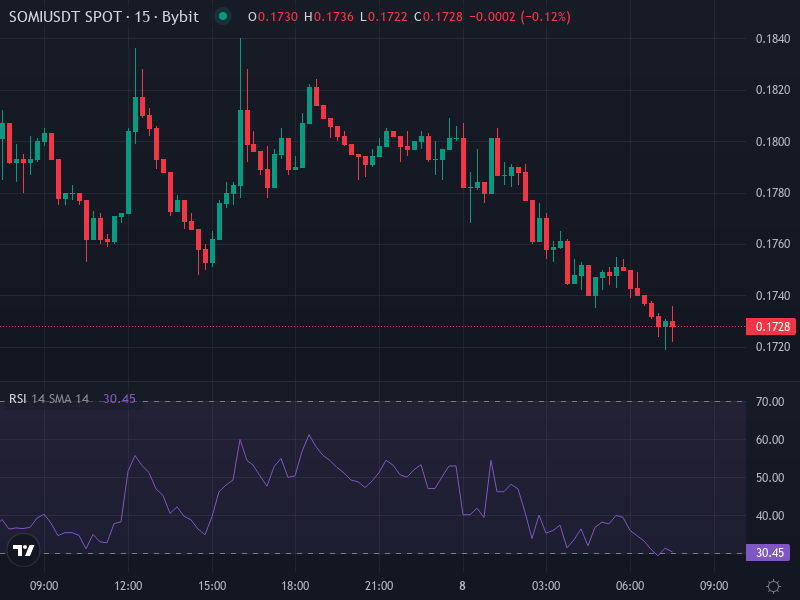
Somnia token (SOMI/USDT) is hovering around $0.17315 right now, having dropped roughly 3.5% in the last day. The charts aren’t painting a pretty picture at the moment. Looking at the 4-hour timeframe, the Relative Strength Index is sitting at 37.39—not screaming oversold, but definitely showing some weakness. The MACD isn’t helping either, with both lines dipping into negative territory, though there’s a tiny positive histogram bar that might hint at momentum trying to shift.
Support and resistance levels are what everyone’s keeping their eyes on right now. The daily pivots suggest we’re looking at some serious resistance walls around $0.190–$0.2283. If things go south, there’s potential support cushions in the $0.1639–$0.1476 range. The tricky part? Price is currently trading below both the 4-hour Simple Moving Average (sitting near $0.1888) and the Exponential Moving Average (around $0.1903), which basically tells us the bears are running the show for now.
Technical Indicators & Patterns
Momentum Indicators: That RSI reading of roughly 37 tells us sellers are applying steady pressure without completely overwhelming the market. The MACD situation is bearish overall—MACD line underneath the signal line—but that small histogram bar could be the early whisper of a reversal if volume shows up to back it up.
Trend & Moving Averages: SOMI is trapped below the key moving averages right now. The 50-EMA, 100-EMA, and 200-EMA are all sitting overhead like a ceiling, creating significant hurdles for any upward movement. Every attempt to push back above even the 50-period EMA has gotten smacked down, which just reinforces how bearish the current structure is.
Support & Resistance Structure: There’s solid support hanging around $0.1747–$0.1852, with a more important level at the $0.1639 pivot point. As for resistance, any bounce would immediately run into trouble around $0.2104–$0.2209, and if it somehow gets through that, there’s heavier resistance clustered near $0.28–$0.36 where those EMAs are stacked up.
Short- & Mid-Term Price Projections
Looking at everything we’ve got right now, the short-term outlook for the next few days to a week is leaning bearish to neutral:
- Bearish Scenario: If we see a breakdown below $0.1747 and that $0.1639 support doesn’t hold, things could get uncomfortable fast with potential tests of $0.15–$0.14. This would likely happen if selling volume picks up and RSI drops below 30.
- Neutral to Bullish Recovery: For bulls to take control, SOMI needs a strong bounce off current support around $0.1747 and then push through that resistance zone near $0.210–$0.220. Reclaiming the 50-EMA (which some projections put above $0.25) would be absolutely critical for any real bullish reversal to stick.
Longer-Term Outlook (Quarter to Year End)
Looking ahead to the end of 2026, projections are all over the map depending on trading volume and overall market conditions. If everything goes right—price breaks above key resistance, the broader crypto market catches fire, ecosystem developments impress—SOMI could potentially climb to $0.40–$0.55. More realistic or conservative scenarios have SOMI drifting sideways between $0.20–$0.30, stuck in range-bound trading for a while.
Key Risk Factors & Influencing Variables
There are several wildcards that could seriously change SOMI’s direction:
- Overall crypto market mood: If the broader market turns risk-off, altcoins like SOMI typically get hammered harder than majors.
- On-chain activity and real adoption: Developer progress, actual network usage, and new liquidity coming in could provide meaningful support.
- Volume backing moves: Without solid trading volume, any push above resistance is likely just a fakeout waiting to happen.
- Those stacked EMAs: Until SOMI convincingly breaks above these layered moving averages, every bounce risks getting rejected right back down.
Final Insight: Strategic Zones to Watch
Whether you’re trading or holding, these are the price zones worth watching closely:
- Keep close tabs on support between $0.174–$0.185. If this zone breaks down, we’re probably heading toward $0.15.
- Watch for action at resistance around $0.21–$0.22—breaking through here would be the first real sign of bullish strength and could open the door to $0.28 and beyond.
- EMA alignment matters: The 50-EMA (roughly $0.25+), along with the 100-EMA and 200-EMA above that—flipping these from resistance to support would completely change the market’s character.