
Short-term Technical Landscape & Market Drivers
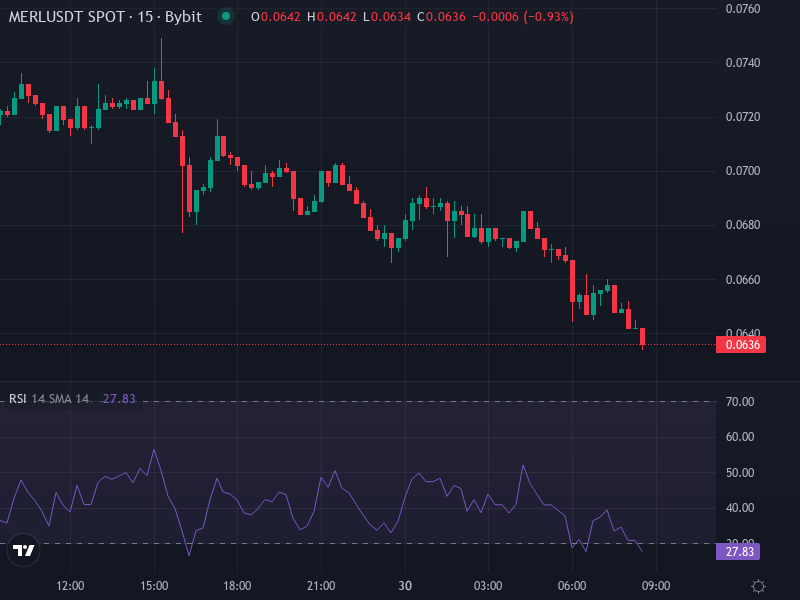
Merlin Chain (MERL) is sitting at roughly $0.06361 right now, after taking a pretty brutal hit with a 12% drop in the last 24 hours. The technical picture isn’t looking great either—pretty much every indicator is flashing red. All the daily moving averages, from the 10-day right up to the 200-day, are screaming “Sell.” The Relative Strength Index is hovering around 14, which puts MERL deep into oversold territory. Williams %R and the Commodity Channel Index are also showing sharp negative readings, suggesting the selling might be getting exhausted—but we’re not seeing any real signs of a turnaround just yet.
There are some fundamental issues weighing on the price too. A massive token unlock happened near the end of 2025, flooding the market with tens of millions of MERL tokens. That kind of supply shock rarely does good things for price. On top of that, the broader crypto market is dealing with macroeconomic uncertainty and regulatory concerns around DeFi, which has investors staying away from riskier altcoins—especially ones with lower liquidity like MERL.
Key Support & Resistance, Potential Triggers
When it comes to support levels, things get a bit tricky. The immediate psychological zone sits somewhere around $0.05-$0.07. Previous Fibonacci-based supports were identified around $0.17–$0.28, but MERL has fallen way below those levels by now. For any kind of bounce to stick, we’d need to see the price hold firmly above $0.060, backed by solid volume that shows actual demand coming back in.
Resistance is going to be tough to crack. Areas that used to provide support have now turned into barriers. If MERL tries to stage a comeback, expect strong resistance around $0.10–$0.12—these levels match up with previous range highs and clusters of moving averages. To really shift the sentiment from bearish to bullish, we’d need to see a couple of key technical developments:
- A bullish MACD crossover, where the MACD line crosses above the signal line with rising histogram bars
- A convincing break above a mid-range exponential moving average—like the 20-day or 50-day—with strong volume backing it up
Without those happening, the downward pressure is likely going to keep grinding away at the price.
Price Prediction Scenarios
Bearish Scenario
If this bearish momentum keeps up—and with the MACD still negative and RSI well below oversold levels—MERL could easily slide further down. A move to $0.040–$0.050 wouldn’t be surprising, especially if the broader crypto market stays weak and sellers keep pushing. Any break below $0.060 would basically open the door to this lower range. This scenario assumes no major positive catalyst comes along and risk aversion continues dominating the market.
Neutral to Mild Bull Case
In a more balanced scenario, MERL might find some footing and stabilize between $0.060 and $0.080. Getting back into this range would need better volume, some relief from the selling pressure caused by those unlocked tokens, and an overall shift in market sentiment. That could come from positive regulatory news or just general strength returning to the crypto market. Even in this case though, that $0.10–$0.12 resistance would probably be pretty hard to break through without something really significant changing.
Longer-Term Bullish Potential
For MERL to stage a proper bullish comeback, a lot of things would need to line up. From a technical standpoint, we’d need to see:
- The price consolidating at current or slightly lower levels with a MACD crossover to the upside
- RSI climbing back toward 50 or higher with consistent buying pressure
- Price breaking above and holding mid-term moving averages like the 50-day and 100-day, turning them from resistance into support
- Some real catalysts—maybe changes to tokenomics, major exchange listings, or protocol upgrades that get people excited again
If all that comes together, MERL could potentially test the $0.15–$0.20 zone as intermediate resistance. But getting up to levels like $0.30 or higher seems pretty unlikely without a dramatic shift in both market conditions and the project’s fundamentals.
Emerging Signals & What to Monitor
What happens next with Merlin Chain really comes down to volume and those key indicator crossovers. Keep an eye out for signs of serious investor interest—things like large buy orders or accumulation activity on exchanges, which could help reverse these oversold conditions. Token unlock schedules are another big risk factor to watch; any more unlocks on the horizon could trigger another wave of selling. And of course, Bitcoin’s performance matters a lot here. If Bitcoin breaks down further, altcoins like MERL typically follow right along with it.