
Recent Developments and Market Context
Momentum (MMT), the governance token powering the Momentum DEX on Sui network, has been sending mixed signals lately. The good news? Upbit finally reopened SUI network deposits and withdrawals in mid-January 2026, which was a massive relief for Asian traders and brought some much-needed liquidity back to MMT. Better access typically means smoother price discovery and more confident investors. The not-so-good news? MMT is still trading way below its private valuation from mid-2025 (around $100 million) with a public market cap closer to $40 million. That’s a pretty harsh reality check and shows the market has significantly cooled its expectations.
There’s still reason for cautious optimism though. The team is rolling out a perpetual DEX in Q1 2026, launching the Token Generation Lab (TGL), and building out Momentum X as a compliance layer. These could all drive value—but it really comes down to whether people actually use the platform, how well the veMMT lock-and-earn mechanism works, and whether they can navigate regulatory hurdles without stumbling.
Technical Indicators: Where MMT Stands Now
Looking at the current charts, MMT appears stuck in consolidation mode. The signals are pretty mixed, suggesting we might see some short-term stability, but there’s still solid resistance overhead keeping a lid on things.
Four-Hour Chart Indicators:
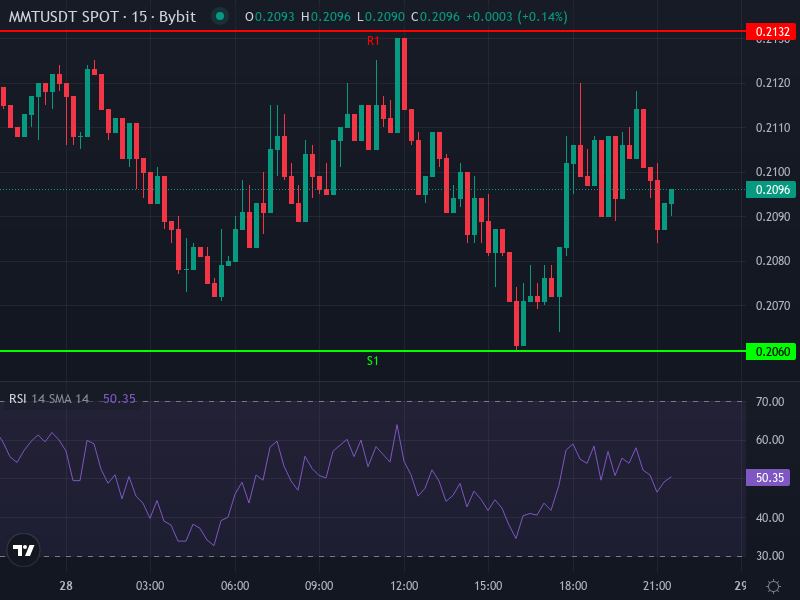
- RSI is hovering around 47.3 on the 4-hour chart—right in that neutral zone where it’s neither oversold nor overbought. Basically, buyers aren’t exactly rushing in yet, which limits near-term upside until we see more committed buying pressure.
- The MACD line sits just below its signal line with a slightly negative histogram reading (about –0.00021). This leans bearish, though not aggressively so. We’d need to see the MACD cross above zero for any real bullish confirmation.
- Both the Simple Moving Average (around $0.2169) and Exponential Moving Average (roughly $0.21235) are sitting above the current price of about $0.20885. That tells us MMT is trading below key moving average resistance levels right now.
Pivot Levels & Price Structure:
Daily pivot analysis shows resistance levels at R1 (~$0.213) and R2 (~$0.2166), while support levels come in at S1 (~$0.206) and S2 (~$0.2022). The pivot point itself is around $0.2094. If MMT can push through and hold above that $0.213 resistance, we could see momentum building toward $0.2166. On the flip side, if support at $0.206 breaks, things could get ugly pretty quickly with a slide toward $0.202 or lower looking likely.
Patterns, Risks, and Forecast Scenarios
Reversal Pattern: Double Bottom—or False Signal?
Some recent technical analysis has spotted what looks like a double bottom pattern on shorter timeframes (like the 15-minute chart) with pattern detection tools showing around 97% confidence. The price rejected lower levels twice, which suggests buyers are defending this support zone and could be gearing up for a bounce. But here’s the thing—these patterns in lower liquidity tokens like MMT can fall apart quickly if a larger seller steps in. So take it with a grain of salt.
Forecast Ranges Based on Technicals
Here’s how things could realistically play out over the next few weeks, based on where support and resistance currently sit and what the broader market looks like.
- Bullish Scenario: If buyers actually show up and push price above that $0.213 resistance level, we could see MMT work its way up to $0.2166, potentially reaching $0.22-$0.225 if volume comes in strong. Fresh catalysts like the perpetual DEX launch could be the spark that lights this move.
- Neutral / Sideways Scenario: MMT keeps bouncing between $0.205 and $0.213, grinding sideways below those moving averages while RSI stays stuck in the middle (40-60 range). Expect choppy, frustrating price action until either a major catalyst emerges or we get a clean technical breakout one way or the other.
- Bearish Scenario: If support at $0.205 gives way, the next stops are $0.2022 and potentially down to $0.1988. Weak volume, those supply unlocks coming in 2026, or disappointing protocol fee revenues could all trigger another leg down. Not fun, but definitely possible.
Important Risk Factors to Monitor
There are several wildcards that could dramatically shift these scenarios:
- Those supply unlocks hitting in 2026—how the team handles them relative to buybacks and veMMT locking will be crucial.
- Protocol fee revenue performance, which directly feeds the buyback mechanism and long-term token value.
- Regulatory developments, especially around Momentum-X and any real-world asset features. Compliance issues or delays could seriously dampen expected value creation.
- Overall crypto market sentiment—let’s be real, smaller altcoins like MMT are extremely vulnerable when the broader market turns risk-off.
Pragmatic Price Prediction
Looking at the technical setup, recent news, and fundamental risks all together, the most realistic expectation is that MMT/USDT will probably trade in a range of roughly $0.205 to $0.216 over the next 2-4 weeks. A solid breakout above $0.216 with decent volume could open up $0.225, while dropping below $0.205 would likely send us down toward $0.198-$0.20. Getting any sustained move above $0.22 probably requires actual delivery on those protocol milestones or a broader lift in DeFi momentum.
Note: These price targets are based on technical pivot levels, moving average resistance, current momentum, and short-term chart patterns—they don’t account for black swan events or major unexpected news.