Current Positioning and Sentiment Drivers
Impossible Cloud Network (ICNT) is sitting at around $0.3945 right now, down roughly −2.05% in the last day. The technical picture looks pretty cautious at the moment. The 14-day RSI is hanging out in neutral-to-weak territory around 44–46, which tells us buying pressure isn’t exactly strong. Meanwhile, the MACD histogram has flipped negative—not a great sign if you’re hoping for a quick reversal.
On the fundamental side, there’s a pretty uncomfortable gap between ICNT’s last private funding valuation (around $470 million) and where its market cap sits today (approximately $60 million). That kind of disconnect usually means trouble. Early investors might be looking for the exits, especially in a market that’s gotten pickier about real revenue versus hype stories.
Key Technical Levels & Signal Confluence
The chart gives us some pretty clear zones to watch. Immediate resistance is stacked between $0.4209 and roughly $0.442—that’s where the 7-day and 30-day moving averages are sitting, and ICNT hasn’t been able to crack through. If it does manage a clean break above that zone, we could see a run toward $0.5508. On the flip side, there’s support near $0.3282. Lose that level, and we’re probably heading down to $0.300 or possibly lower.
The moving average picture is mostly bearish—price is trading below the 30-day and 50-day lines, though some of the shorter-term averages show occasional flickers of hope. Most momentum indicators like MACD, Stochastic, and CCI are flashing weak or negative signals, with only a few hinting at oversold conditions. Volatility is running high based on ATR readings, so expect some chunky intraday swings, especially around those key support and resistance zones.
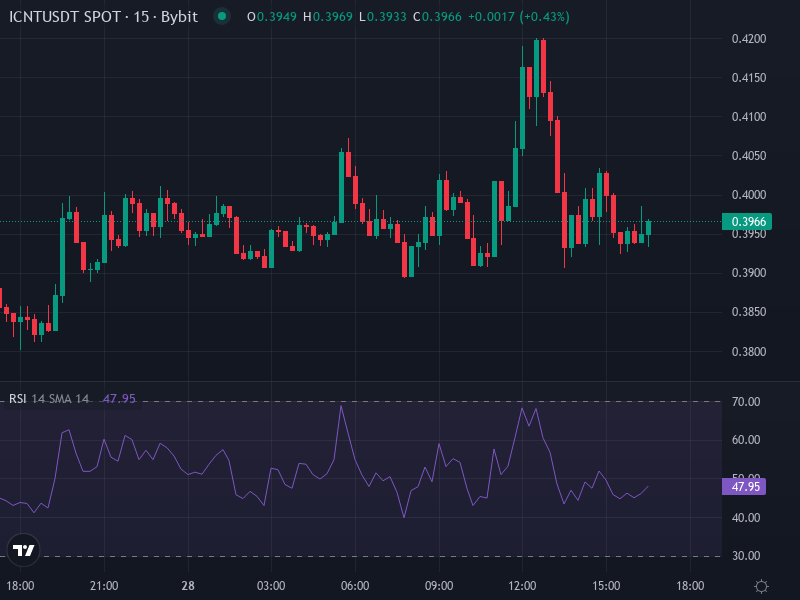
Here’s a chart reference for anyone following the price action:
Price Forecasts: What to Expect Short- to Medium-Term
Scenario A — Bearish Continuation
If ICNT can’t punch through that $0.4209-0.442 resistance ceiling, we’re probably looking at more downside. That $0.3282 support level becomes super important. Break below it, and selling could pick up steam fast—possibly taking us down to $0.300, maybe even into the $0.250-$0.280 range if things get ugly. This scenario would need both a technical rejection at resistance and continued thin liquidity. The declining volume, negative MACD, and RSI stuck below the major moving averages all point in this direction.
Scenario B — Relief Bounce / Bullish Reversal
Now, if buyers show up and ICNT starts closing above the 7-day EMA (around $0.398) and begins challenging that 30-day SMA near $0.442, we could see a decent relief bounce. First, that $0.4209 resistance needs to fall, then a move toward $0.5508 becomes realistic. Real-world adoption news—like growing revenue or new enterprise clients—would definitely help. But for this to stick, we’d need to see ICNT reclaim those moving average zones with volume backing it up. Otherwise, we’re just looking at a weak bounce that fizzles out.
If I had to put numbers on it, I’d say there’s probably a 60-70% chance ICNT tests or breaks below $0.3282 before any serious recovery takes hold. A sustained push toward $0.55 in the near term? Maybe 30-40% odds, and that’s only if we get some positive catalysts.
Long-Term Outlook
Looking further out over several months to a year, projections suggest ICNT could climb toward $0.6406 by the end of 2026—assuming enterprise revenue picks up and the token buyback model actually delivers. In a really bullish scenario, some are throwing out targets above $1.20. But that’s a big “if” depending on broader market conditions, crypto sentiment, and whether the project can close that gap between current valuation and where institutional money valued it.
Trading Strategies & Risk Management
For active traders, keep your eyes on that $0.420-0.442 resistance zone. Short sellers might look for entries if price gets rejected there. Aggressive traders could use TD Sequential or similar reversal setups on lower timeframes, especially if you see volume spike and oscillators turn supportive. Just make sure you’re using stop losses—probably below $0.3282 or recent swing lows—to keep losses manageable.
If you’re thinking about a longer-term position, pay attention to what’s happening with partnerships, client growth, and token unlock schedules. Try to build positions near solid support levels and keep your sizing moderate given the volatility. For upside targets, $0.55 is the first reasonable goal, then $0.64 if momentum holds.