
Introduction & Context
DOGE/USDT is currently trading at 0.1217861514, up a modest +1.86% in the last 24 hours. While that sounds positive on the surface, DOGE is actually sitting in a pretty tricky spot when you look at the bigger picture on the 4-hour chart. The market seems indecisive right now—buyers are trying to push things higher, but the momentum just isn’t quite there yet.
Looking at the moving averages, the 4-hour Simple Moving Average (SMA) sits around 0.12347533, with the Exponential Moving Average (EMA) hovering just above at roughly 0.12368044. That means there’s resistance right overhead. The Relative Strength Index (RSI) is reading about 44.16, which tells us things are pretty neutral, maybe leaning slightly bearish. The MACD is showing something interesting though—the MACD line (around -0.00111166) is sitting just above the signal line (about -0.00137045), creating a tiny positive histogram. That hints at a weak bullish divergence, but it’s still stuck below zero, so nothing to get too excited about just yet.
Support & Resistance Zones + Pivot Points
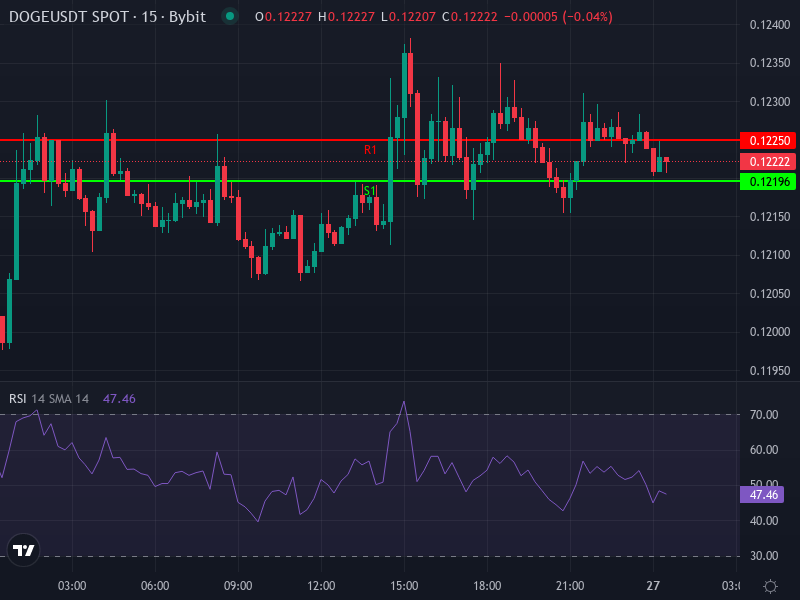
The daily pivot points paint an interesting picture—they’re all bunched together pretty tightly, which usually means we’re dealing with low volatility and a narrow trading range. The main pivot point (P) is sitting at about 0.12222333. Above that, we’ve got resistance at R1 (roughly 0.12249667), R2 (around 0.12276333), and R3 (near 0.12303667). On the flip side, support levels come in at S1 (about 0.12195667), S2 (around 0.12168333), and S3 (near 0.12141667).
Right now, the price is trading below both the 4-hour SMA and EMA, which are acting as a ceiling. Meanwhile, the pivot resistance levels are only slightly higher than where we’re trading now. Support isn’t exactly rock solid either—it’s only a few ticks below current price. When everything’s this close together, it usually means a significant move is brewing. We just don’t know which direction yet.
Pivotal Levels & Potential Scenarios
If the bulls can manage to push through resistance in the 0.1235-0.1240 zone, we could see DOGE test R3 around 0.1230367. On the other hand, if support at S1 (roughly 0.12196) doesn’t hold, we could drop down to S2 and S3, somewhere in the 0.1214-0.1217 range. Given how tightly packed these levels are, even a small shift in sentiment or trading volume could push DOGE decisively in either direction.
Momentum Conditions & Trend Signals
With RSI sitting under 50, there’s some mild bearish pressure in play, though we’re not seeing confirmation of a full-blown downtrend yet. That slightly positive MACD histogram suggests we might be in the early stages of some bullish momentum building up—but that’s only if buyers actually follow through. The problem is both the SMA and EMA have been trending down recently, which reflects the bearish tone we’ve seen lately.
Volume is another piece of the puzzle we need to watch closely. Right now, we’re not seeing any major volume spikes, which makes it harder to feel confident about any potential breakouts. If you look at past DOGE rallies, they were usually preceded by big volume surges from institutional players or whales. Without that kind of firepower today, any push beyond resistance is probably going to face some serious resistance and get tested quickly.
Price Prediction & Scenarios
Given what the indicators and chart structure are telling us, the most likely scenario for the near term—say the next 1-3 trading sessions—is that DOGE will consolidate between roughly 0.1215 and 0.1235.
Bullish Scenario: If we get a volume-driven rally, DOGE could break above that resistance around 0.1235 and head toward R1 and R2 in the 0.12250-0.12375 range. If momentum really picks up, we might even see a push toward 0.1250.
Bearish Scenario: If the price drops below support at around 0.12196 (that S1 level), we’re probably looking at a slide down to about 0.1214. If sentiment really sours, there’s additional downside risk considering how close we are to the S3 pivot level.
Key Trigger Levels to Watch: Keep your eyes on resistance around 0.1235-0.1240 and support at about 0.12196. If RSI climbs above 50 or the MACD crosses into positive territory, that would favor the bulls. On the other hand, RSI dropping below 40 or a breakdown below support would likely give bears the upper hand.
Broader Sentiment & External Risks
While technical indicators are great for predicting near-term moves, we can’t ignore what’s happening in the bigger picture. Things like regulatory announcements, macroeconomic shifts, or news about institutional adoption could shake things up quickly. DOGE is especially sensitive to news and social media narratives, so any major headlines could act as either a catalyst or a risk factor in the short term.