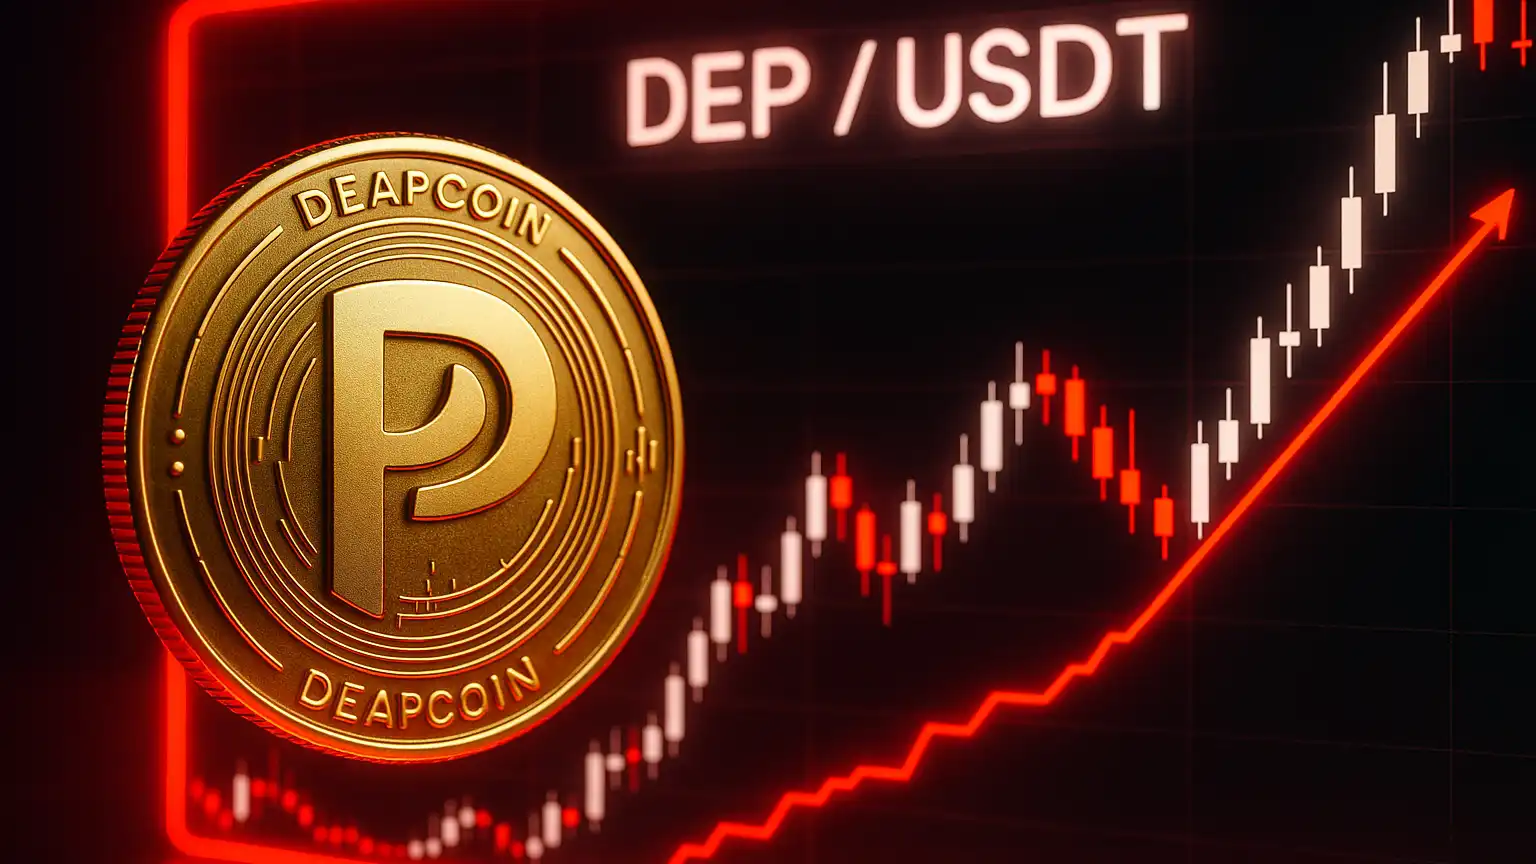
Introduction: Market Context and Recent Developments
Right now, DEAPcoin (DEP) is sitting at around $0.0014323 USD when paired with USDT, down roughly -0.95% over the past day. The altcoin market has been all over the place lately, with trading volume dropping off and some exchanges pulling the plug on certain pairs—both of which have hurt accessibility and overall sentiment. A big example: OKX removed the DEP/USDT pair back in late November 2025, which caused volume to tank by more than half. DEP did manage to claw back some ground after that, but it’s clear there’s still a lot of uncertainty around liquidity and how confident investors really are. That said, some technical signals are hinting at potential opportunities if you know where to look.
Technical Indicators & Key Levels
When you look at DEP/USD across different charting platforms, the picture is mixed—but there’s a slight lean toward bullish momentum if certain price levels can be broken through. Technical analysts are pointing to resistance between $0.00167 and $0.00208, with that $0.00167 mark being the first real obstacle to watch. On the downside, support appears to be holding around $0.00138, though if that gives way, we could see it test lower levels near $0.00130 or even $0.00125.
Diving into the on-chain technicals, things get interesting. The 14-day Relative Strength Index (RSI) has been running hot—often pushing above 70—which typically signals overbought conditions on the daily chart. Meanwhile, several key moving averages (the 10-day, 20-day, and 50-day) are sitting below the current price, which suggests there’s been some upward momentum building. However, Bollinger Bands show price is hugging the upper band right now, which raises the risk of a pullback. Adding to that, momentum and stochastic indicators are starting to show signs of weakening near those resistance zones.
Price Projections & Scenarios
Bullish Scenario
If DEP can push through and close above that $0.00167 resistance with solid volume backing it, we might see it rally toward the $0.00200–$0.00220 range over the next few weeks to a month. For that to happen, you’d want to see stronger bullish signals come through—like the RSI climbing past 80 and buyers really stepping in to establish the next resistance zone. Some forecasts are already projecting gains around 16%, targeting roughly $0.001615 by mid-February 2026 if conditions stay favorable.
Bearish/Consolidation Risk
On the flip side, if DEP fails to crack that $0.00167 level, we could easily see a pullback or just sideways movement for a while. The key support to watch in that case is around $0.00138. If that breaks, the next stops could be $0.00130 or $0.00125. Given that the RSI is elevated, Stochastics are showing overbought readings, and price is sitting at the upper Bollinger Band, there’s definitely an increased risk of a retracement. Volume will be critical here—if it stays weak, we’re more likely to see a collapse than a healthy consolidation.
Longer-Term Outlook
Looking further out into mid-2026, projections are all over the map but generally point toward gradual upside—assuming things like exchange access, liquidity, and on-chain activity improve. Some models are estimating a trading range somewhere between $0.00140 and $0.00350 over the next six to twelve months, though that depends heavily on adoption rates and where the broader crypto market is headed. Those elevated resistance levels are going to be tough to crack unless we get some strong macro tailwinds—think bullish Bitcoin action, favorable regulation, that sort of thing.
Important Factors to Monitor
If you’re trading or investing in DEP, here’s what you should keep an eye on:
- Volume spikes when price tries to break resistance—without that, breakouts are probably fake.
- RSI and stochastic oscillators hitting overbought or oversold extremes—these can signal potential reversal points.
- Exchange listings or relistings, which can have a huge impact on liquidity and how sensitive the price is to moves.
- Overall crypto market conditions, including Bitcoin’s dominance, regulatory headlines, and interest rate trends.