Recent Project Developments and Market Sentiment
ICON has been going through some major changes since late 2025. The original blockchain merged with the Balanced protocol and rebranded as SODAX on the EVM-compatible Sonic chain. This meant retiring or migrating governance tokens like BALN, restructuring liquidity infrastructure, and building cross-chain swap capabilities across more than a dozen chains to reduce fees and make things easier for users. While this shift could bring real upside for ICX through increased demand and utility, there’s also some integration risk as the migration plays out. On a positive note, Upbit has started allowing ICX deposits and withdrawals again, particularly for Korean trading pairs, which should help with retail access and trading volume.
Technical Indicators: Current Trends and Key Levels
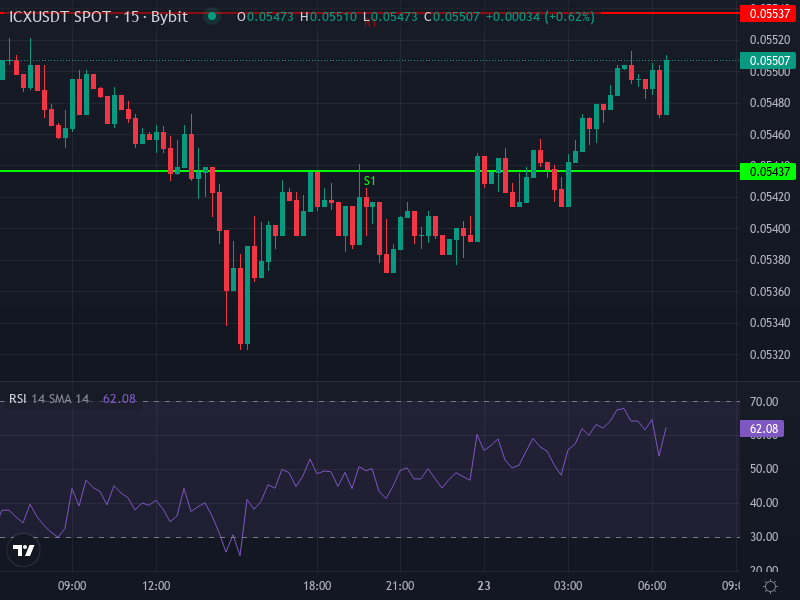
Right now, ICX is trading around $0.05482, down about 0.32% over the last 24 hours. Looking at the 4-hour chart, the Relative Strength Index sits at roughly 45.55—pretty neutral, maybe slightly bearish, but definitely not oversold. The MACD line is hovering around −0.00078, with the signal line at −0.00087 and a tiny positive histogram. This suggests we might be seeing a bit of bullish divergence, though we’re still in bearish territory overall.
Short-term moving averages paint a cautious picture. The 4-hour Simple Moving Average is sitting at about $0.05586, with the Exponential Moving Average very close at $0.05582. Since both are above the current price, there’s overhead resistance forming and some immediate downward pressure on price.
Daily pivot levels give us some key zones to watch: the pivot point is around $0.05473, with resistance levels at roughly $0.05537, $0.05573, and $0.05637. Support zones sit near $0.05437, $0.05373, and $0.05337. If price breaks below these support levels, we could see further downside. Breaking above resistance could trigger a short-term bounce.
Price Forecast: Scenarios Over the Next Weeks to Months
Bearish Scenario (Weak Volume, Failed Resistance)
If ICX can’t push through that resistance band around $0.0558 on the 4-hour chart and drops below the daily pivot support at $0.0547, we’re probably looking at a slide toward $0.0537, possibly down to $0.0534. Weak trading volume or negative macro conditions could keep the pressure on, especially if traders stay cautious about altcoins in general. In a worse case scenario, ICX could test the $0.0525–$0.0515 range if sentiment really turns sour. The technicals suggest upside will stay limited unless something changes the picture.
Bullish Scenario (Cross-Chain Pull-Through & Burn Acceleration)
On the flip side, if SODAX cross-chain swaps really take off and liquidity migration goes smoothly, we could see meaningful demand for ICX. The token has a fee-burn mechanism tied to protocol revenue, so more DeFi activity could tighten supply. If ICX breaks above $0.0558 and holds daily support, there’s room for a rally toward $0.0600. In a more optimistic scenario, we could even see targets around $0.065 within one to two months—assuming the Sonic migration wraps up cleanly and liquidity grows through new listings or institutional interest.
Medium-Term Outlook (3-6 Months)
Over the next few months, ICX will likely trade somewhere between $0.055 and $0.070. The higher end depends on cross-chain volume picking up and burn metrics improving. Some forecasts point to around $0.065 by mid-February if the technical picture comes together—that would be roughly a 9-10% gain from here. But if momentum doesn’t hold, we could easily retest multi-week lows around $0.050–$0.052, since current sentiment and liquidity are still pretty fragile.
Final Insight: Risk vs. Reward Balance
ICON’s shift to the SODAX model brings real utility and potential deflationary pressure—those are structural positives that could drive upside in the right market conditions. But there’s execution risk with the token migration and exchange support, and the short-term technicals combined with low volume mean downside is definitely possible near term. For anyone trading ICX, keep a close eye on resistance around $0.0558, support near $0.0540–$0.0535, and DeFi metrics like swap volume and burn rate. These will likely tell us whether ICX drifts lower or manages to push back above $0.060.