Market Context & Recent Developments
The 0x Protocol (ZRX) has been moving through an interesting mix of technical strength and fundamental changes lately. Over the past few weeks, the token has caught a nice tailwind from the rotating interest in altcoins, putting it in a better position compared to many of its peers. The team has been busy shipping updates and integrations—especially around their multi-chain Swap API and new partnerships with aggregators—which has definitely helped build a stronger story around actual use and adoption. There were some earlier security scares (mainly involving MEV exploits and excessive allowances in third-party wrappers) that got people worried, but the dev team’s quick response showed that the core protocol itself is still solid, which helped calm nerves a bit.
Looking at price action, ZRX/USDT just posted a strong 24-hour jump of over 7%, currently trading around $0.11245. This sharp move doesn’t seem tied to any single piece of news—it looks more like several technical factors lining up at once, especially as price pushed through multiple resistance levels during the day. Momentum indicators are starting to look healthier, though we’re seeing some overbought readings here and there that suggest you probably shouldn’t just blindly chase this move. The mixed signals point toward a smarter, more tactical approach: figure out where the next resistance sits, respect the key support levels, and wait for volume to confirm what’s happening.
Technical Indicators & Trend Structure
Let’s break down what the latest 4-hour chart for ZRX/USDT is telling us:
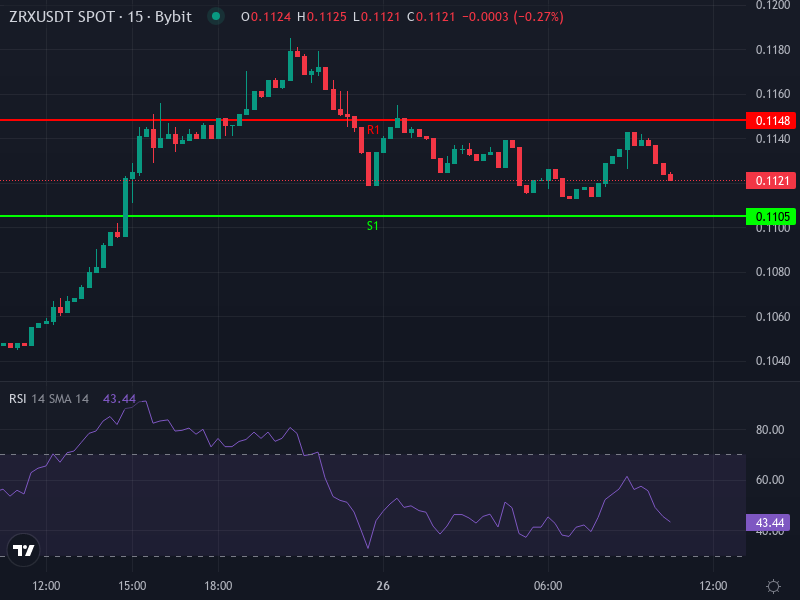
RSI (4-hour): ~59.10 — showing decent bullish momentum without being stretched
MACD line vs Signal: we've got a positive crossover
MACD Histogram: positive (~0.00110) — momentum is building on the buy side
4-hour SMA: ~$0.10711 — price is sitting above this right now
4-hour EMA: ~$0.10811 — same story, current price is above both short-term moving averages
The daily pivot points give us a nice roadmap for support and resistance zones. The main pivot sits at $0.11300, with resistance stepping up at $0.11480, $0.11730, and $0.11910. On the downside, we’ve got support levels near $0.11050, $0.10870, and $0.10620. The daily rate of change is running around +2.18%, which backs up the recent strength we’ve been seeing. Since price is now above both the 4-hour SMA and EMA, those moving averages should work as dynamic support if we get any pullback action.
What These Indicators Mean Realistically
The climbing RSI and positive MACD histogram on the 4-hour timeframe tell us that buyers are starting to take control in the short run. Breaking above both the 4-hour SMA and EMA adds another check in the bullish column. The good news is that RSI hasn’t hit extreme levels yet, which means there’s still some runway before things get overheated. That said, if volume doesn’t show up to support these moves or if the broader market turns sour, we could easily see a test of that pivot near $0.11300 or support around $0.10870.
Price Prediction Scenarios
Based on what the technicals are showing us and where support and resistance sit, here are some realistic scenarios for where ZRX/USDT could head in the short to medium term:
- Base Case (Bullish Continuation): If price can stay above the 4-hour EMA (~$0.10811) and doesn’t break below the support zone around $0.10870–$0.11000, we’re probably looking at a move toward resistance at $0.11480 and possibly $0.11730. If momentum really kicks in and we break through those levels, $0.11910 becomes the next realistic target.
- Consolidation / Pullback: If price can’t hold above ~$0.10811, we might see a pullback down to $0.10620 or even $0.10400. Keep your eyes on how price behaves at those support levels—look for signs of a base forming, like hammer candles or bullish engulfing patterns that suggest buyers are stepping back in.
- Bear-Risk Scenario: If the broader market takes a dive (think weak Bitcoin or Ethereum price action) or if a key support level gets smashed convincingly, a drop below $0.10400 could open the door to $0.10000 or lower. In this situation, the current short-term momentum would likely fizzle out, with the MACD losing steam and RSI dropping back below neutral.
Key Levels & Risk Management
If you’re trading ZRX and want to keep things disciplined, here are the important levels and risk considerations to keep in mind:
- Support Zones: Primary support sits near $0.10870–$0.11000, with secondary support down at $0.10620.
- Resistance Zones: Near-term resistance at $0.11480 → $0.11730; stronger ceiling around $0.11910 if this move keeps going.
- Stop-Loss Ideas: If you’re long, consider placing stops just below the nearest solid support (like below $0.10620) to limit your downside. If you’re shorting, stops above $0.11480 make sense to protect against breakout scenarios.
- Volume Confirmation: Pay attention to whether daily and 4-hour volume actually increases on upward moves. If you’re seeing price push higher on weak volume, that’s often a trap waiting to happen.
Integrating the Technical Data Input
Looking at the raw technical data we’re working with:
Ticker: ZRX/USDT
Current Price: 0.1124491631283644
24-h Price Change: +7.1956%
4-h RSI: ~59.10
4-h MACD Line ≈ 0.00165, Signal ≈ 0.00055 → bullish crossover
4-h SMA: ~0.10711, EMA: ~0.10811
Daily Pivot Points as above
Rate of Change (Daily): ~+2.18%
These numbers back up a near-term bullish outlook. The MACD crossover and price breaking back above those key 4-hour moving averages show that short-term momentum has shifted back to the buyers. The rate of change is positive but still moderate—it shows acceleration without being crazy extreme, which means there’s still room for either a retracement or some sideways consolidation.
Forecast & Final Thoughts
When you put all the pieces together, a realistic target range over the next 1-3 weeks sits somewhere between $0.11480 and $0.11910, assuming those support zones hold up and momentum stays intact. A more conservative target would be around $0.11730. On the flip side, a correction back toward $0.10620 is absolutely on the table, especially if momentum starts to fade or the broader market takes a hit.
Bottom line: ZRX looks like it’s entered a phase where the technicals are getting stronger—short-term indicators are lining up for potential bullish continuation, but we’ve still got to watch out for overbought conditions and respect those key support levels. The smart play here is to stay flexible, protect your downside with proper stops, and use confirmed resistance breakouts as your green light for further upside potential.